ob-analytics
Limit order book analytics and visualization for Python.
Load order events, attach authoritative trades (Bitstamp trades.csv or
LOBSTER executions), classify order types, compute depth metrics, and
visualize market microstructure — from Bitstamp-style CSVs or
LOBSTER message and orderbook files.
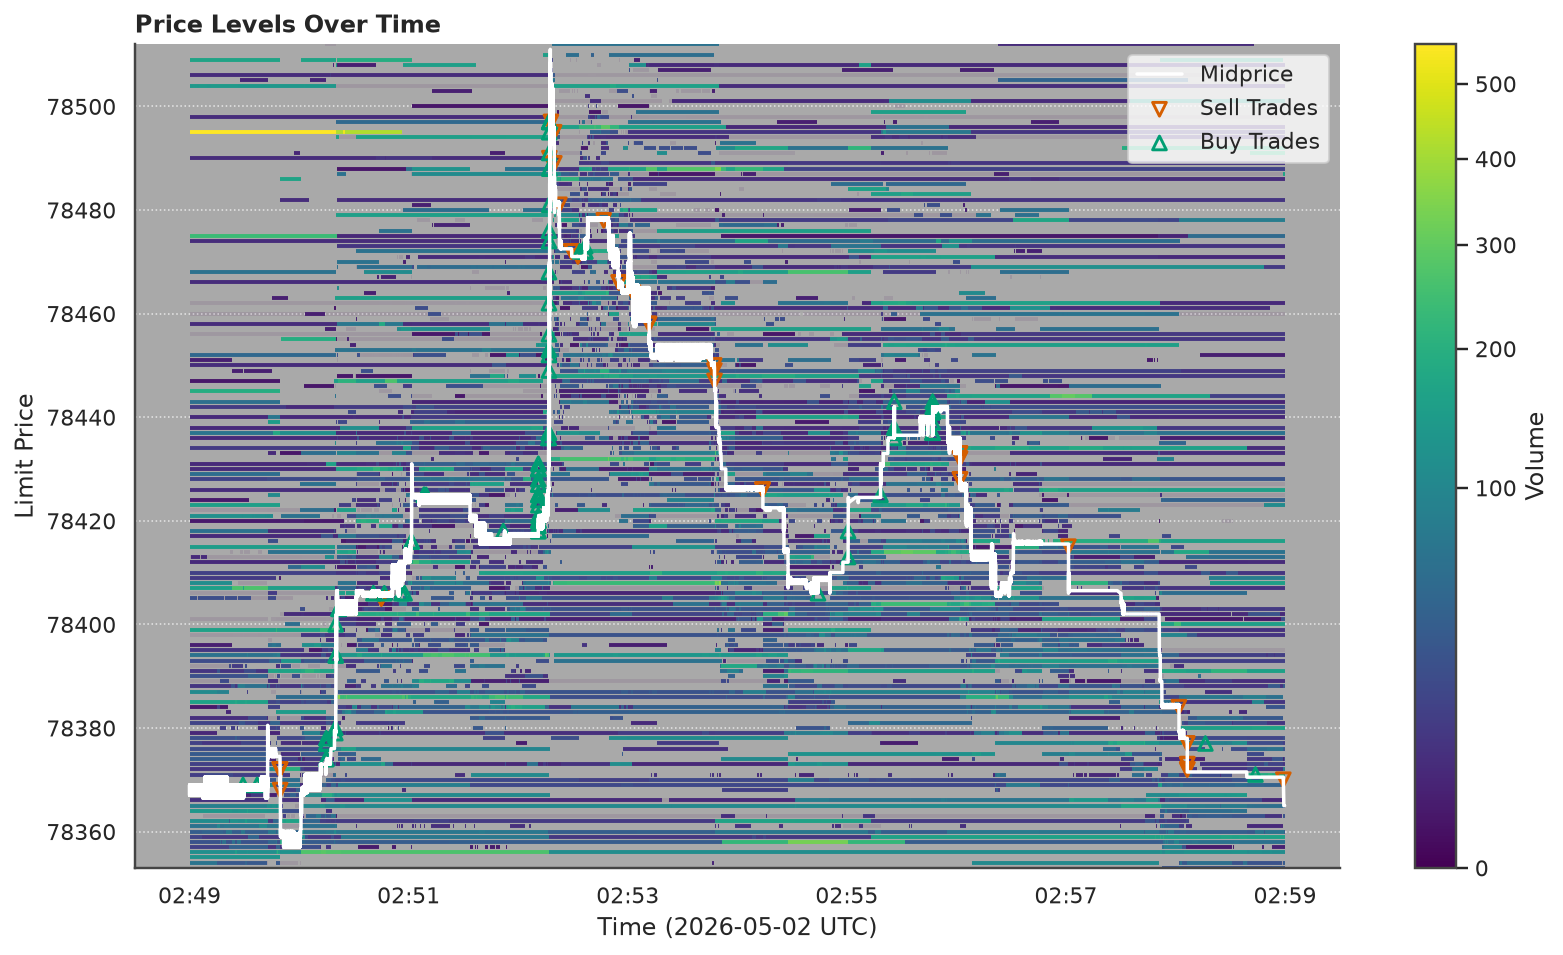
Standing volume at every price over ten minutes of the bundled Bitstamp BTC/USD capture — one of a dozen figures the package draws. The tutorial builds this one up from first principles.
Three lines get you there:
from ob_analytics import Pipeline, sample_csv_path

result = Pipeline().run(sample_csv_path())         # load + classify + depth
result.plot("depth_heatmap")                       # the figure above
Explore the docs
Getting started
Install, run the pipeline on the bundled sample, and render your first plot — about ten minutes.
Tutorial
A guided tour from what a price is through L3 order-book reconstruction, depth, and flow toxicity — every figure built up on toy data first.
How-to guides
Task-focused recipes: your own data, LOBSTER, custom loaders, theming and export, live capture, the CLI.
Reference
Module-by-module API docs, the data contracts, and a glossary of the microstructure terms.
Architecture
Pipeline stages, design decisions, the class diagram, the module map, and the scale envelope.
What it does
| Stage | Description |
|---|---|
| Load & normalize | Parse Bitstamp CSV or LOBSTER message file into a uniform event DataFrame |
| Build trades | Bitstamp: companion trades.csv. LOBSTER: execution rows (types 4/5) in the message file |
| Classify orders | Label as market, resting-limit, flashed-limit, market-limit, or unknown |
| Depth & metrics | Price-level volume, best bid/ask, spread, liquidity in BPS bins |
| Flow toxicity (post-run) | VPIN, Kyle's lambda, order-flow imbalance from result.trades |
| Visualize / export | Depth heatmaps, event maps, trade charts, galleries; Matplotlib or Plotly; Parquet and LOBSTER round-trip I/O |
Pipeline
flowchart LR
    subgraph in["Inputs"]
        CSV[Bitstamp orders + trades]
        LOB[LOBSTER msg + orderbook]
    end

    subgraph pipeline["Pipeline"]
        direction TB
        L[Load & normalize]
        T[Build trades]
        C[Classify orders]
        D[Depth metrics]
        L --> T --> C --> D
    end

    subgraph out["Outputs"]
        EV[Events · Trades]
        DP[Depth · Summary]
        VZ[Plots · Parquet · LOBSTER files]
    end

    CSV --> L
    LOB --> L
    pipeline --> EV
    pipeline --> DP
    EV & DP --> VZ
All processing stages are pluggable via Protocol interfaces. See the Architecture page for the full class diagram, design decisions, and module map.
Other data sources
ob-analytics process orders.csv -o results/
ob-analytics gallery results/parquet/ -o my_gallery/
ob-analytics bitstamp-demo --input orders.csv
See Run from the command line for every subcommand.
Implement the EventLoader protocol — any object whose
load() returns validator-passing frames is a loader. See
Plug in custom components.