Example gallery
Every figure ob-analytics draws, rendered from the bundled Bitstamp sample. Click a thumbnail for the full figure and the exact code that produced it. New to these? The tutorial builds each one up from first principles.
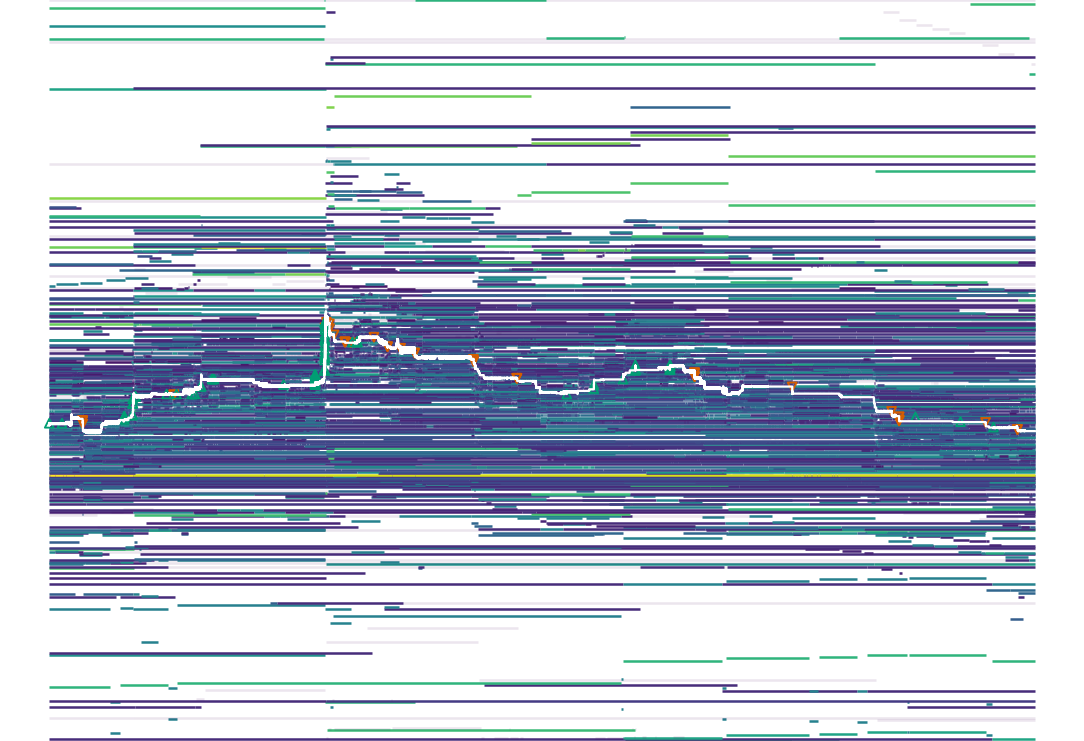
Depth heatmap
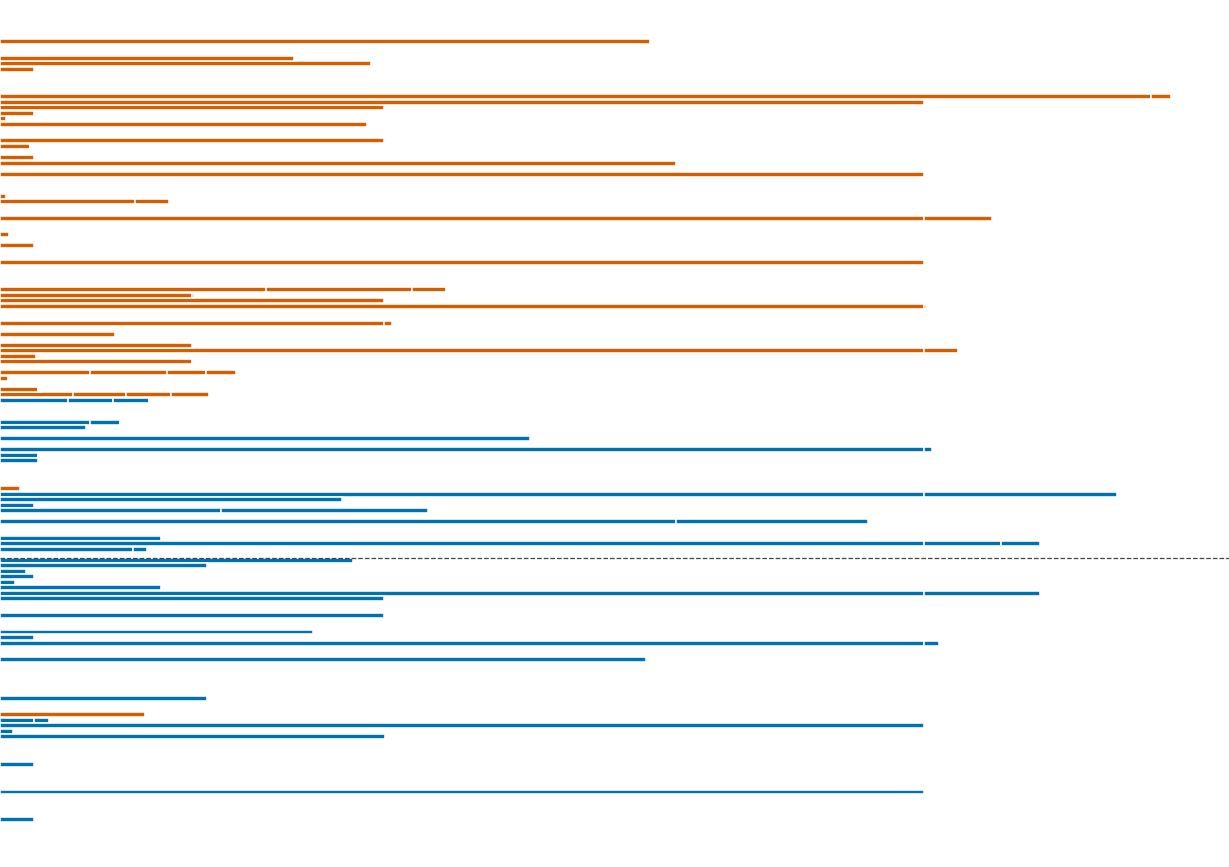
Book snapshot (L3)
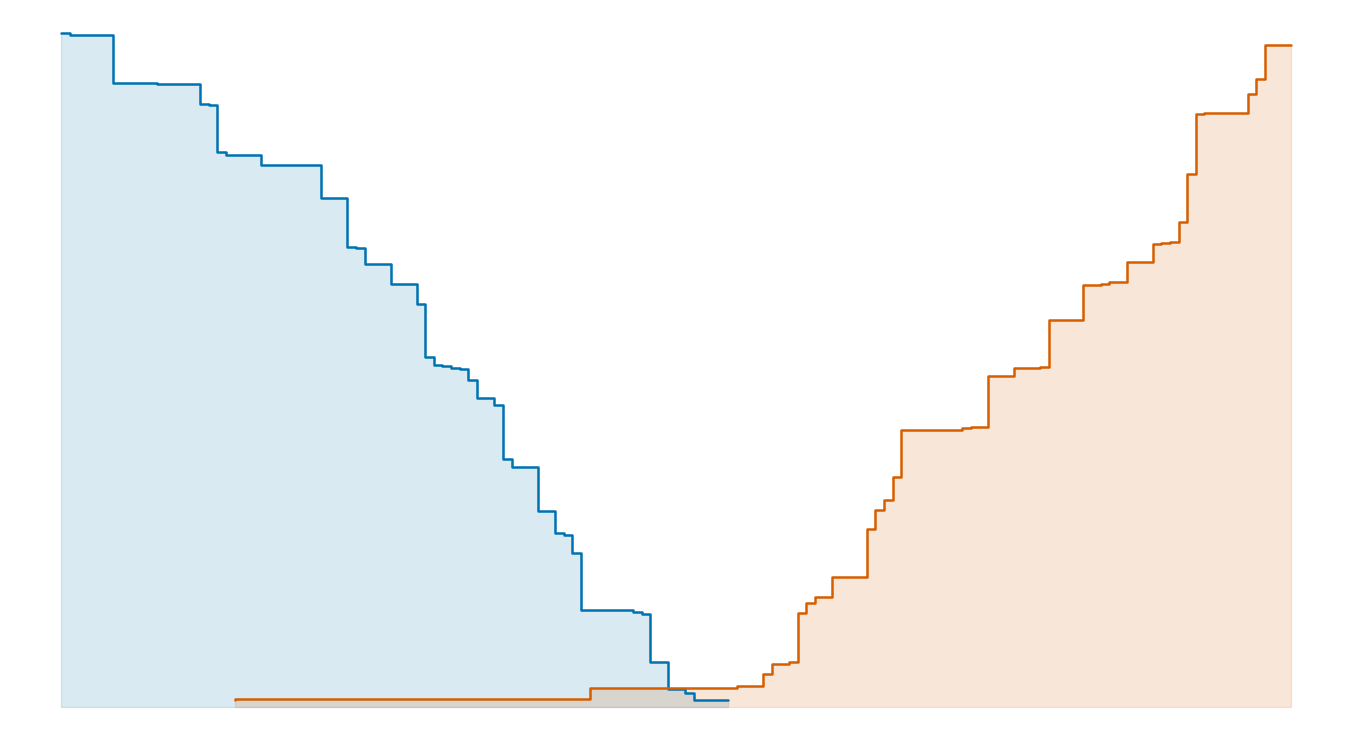
Depth chart
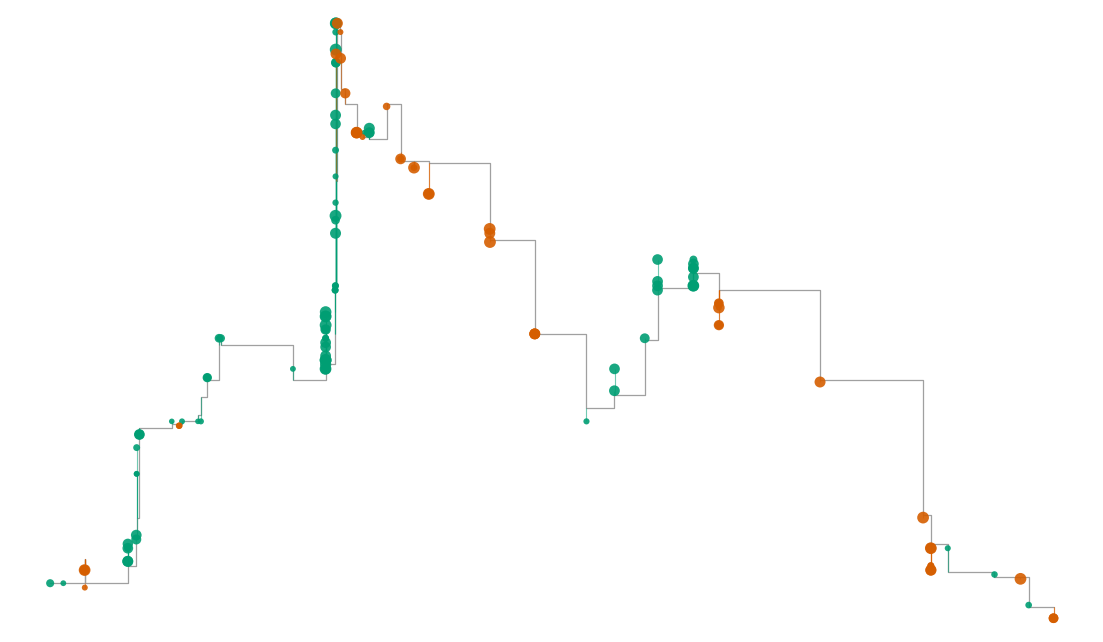
Trade tape
Volume percentiles
Liquidity at touch
Order outcomes (L3)
Queue position (L3)
Cancellations (L3)
VPIN
Kyle's lambda
Order flow imbalance
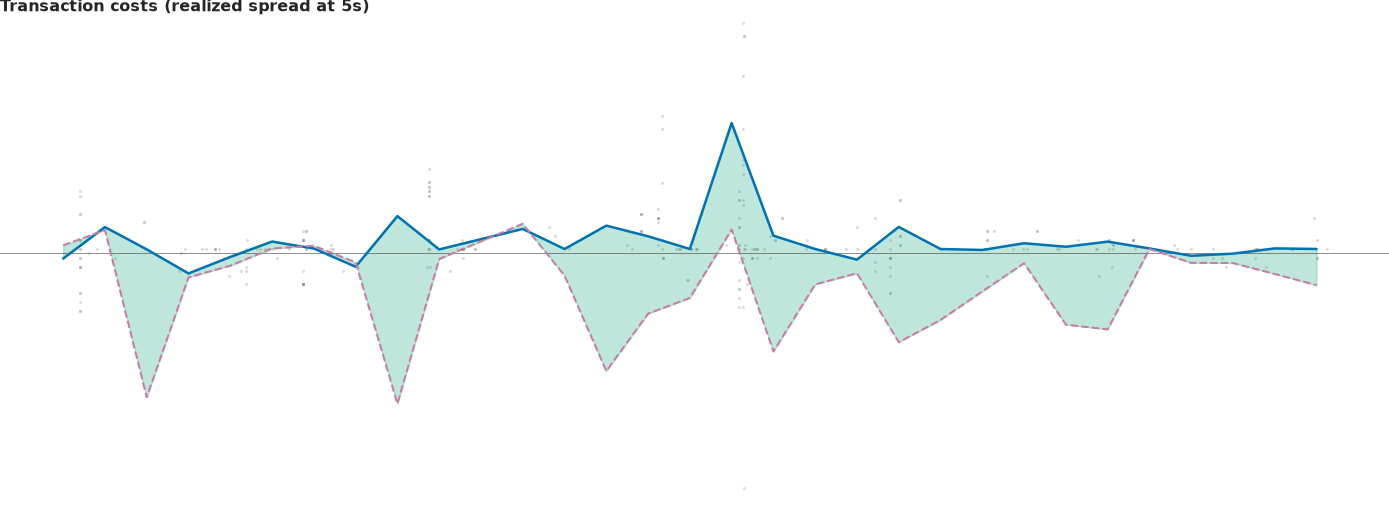
Transaction costs
The book
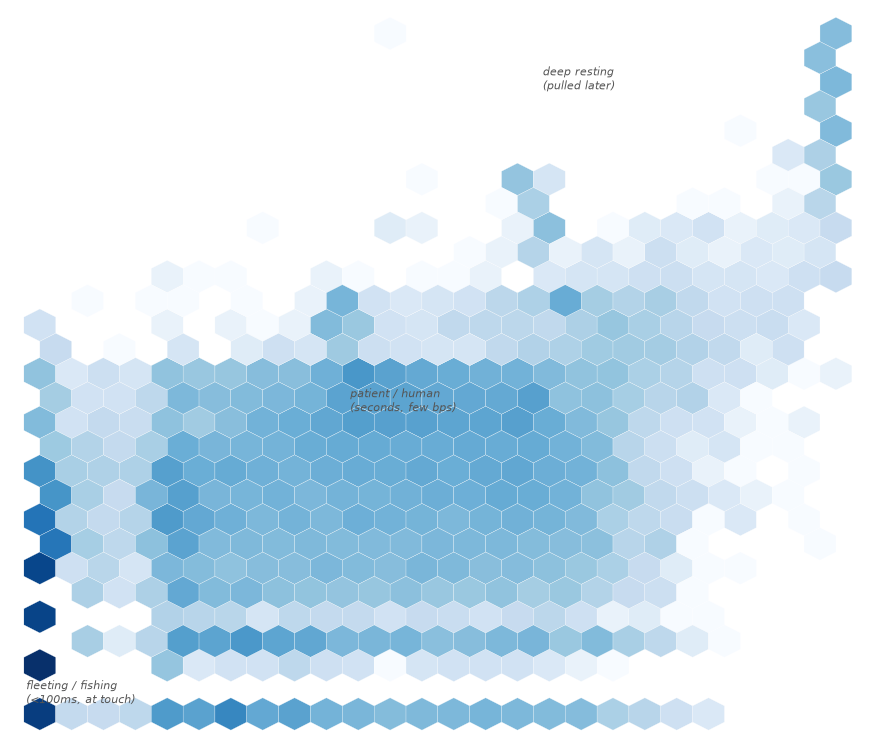
Depth heatmap
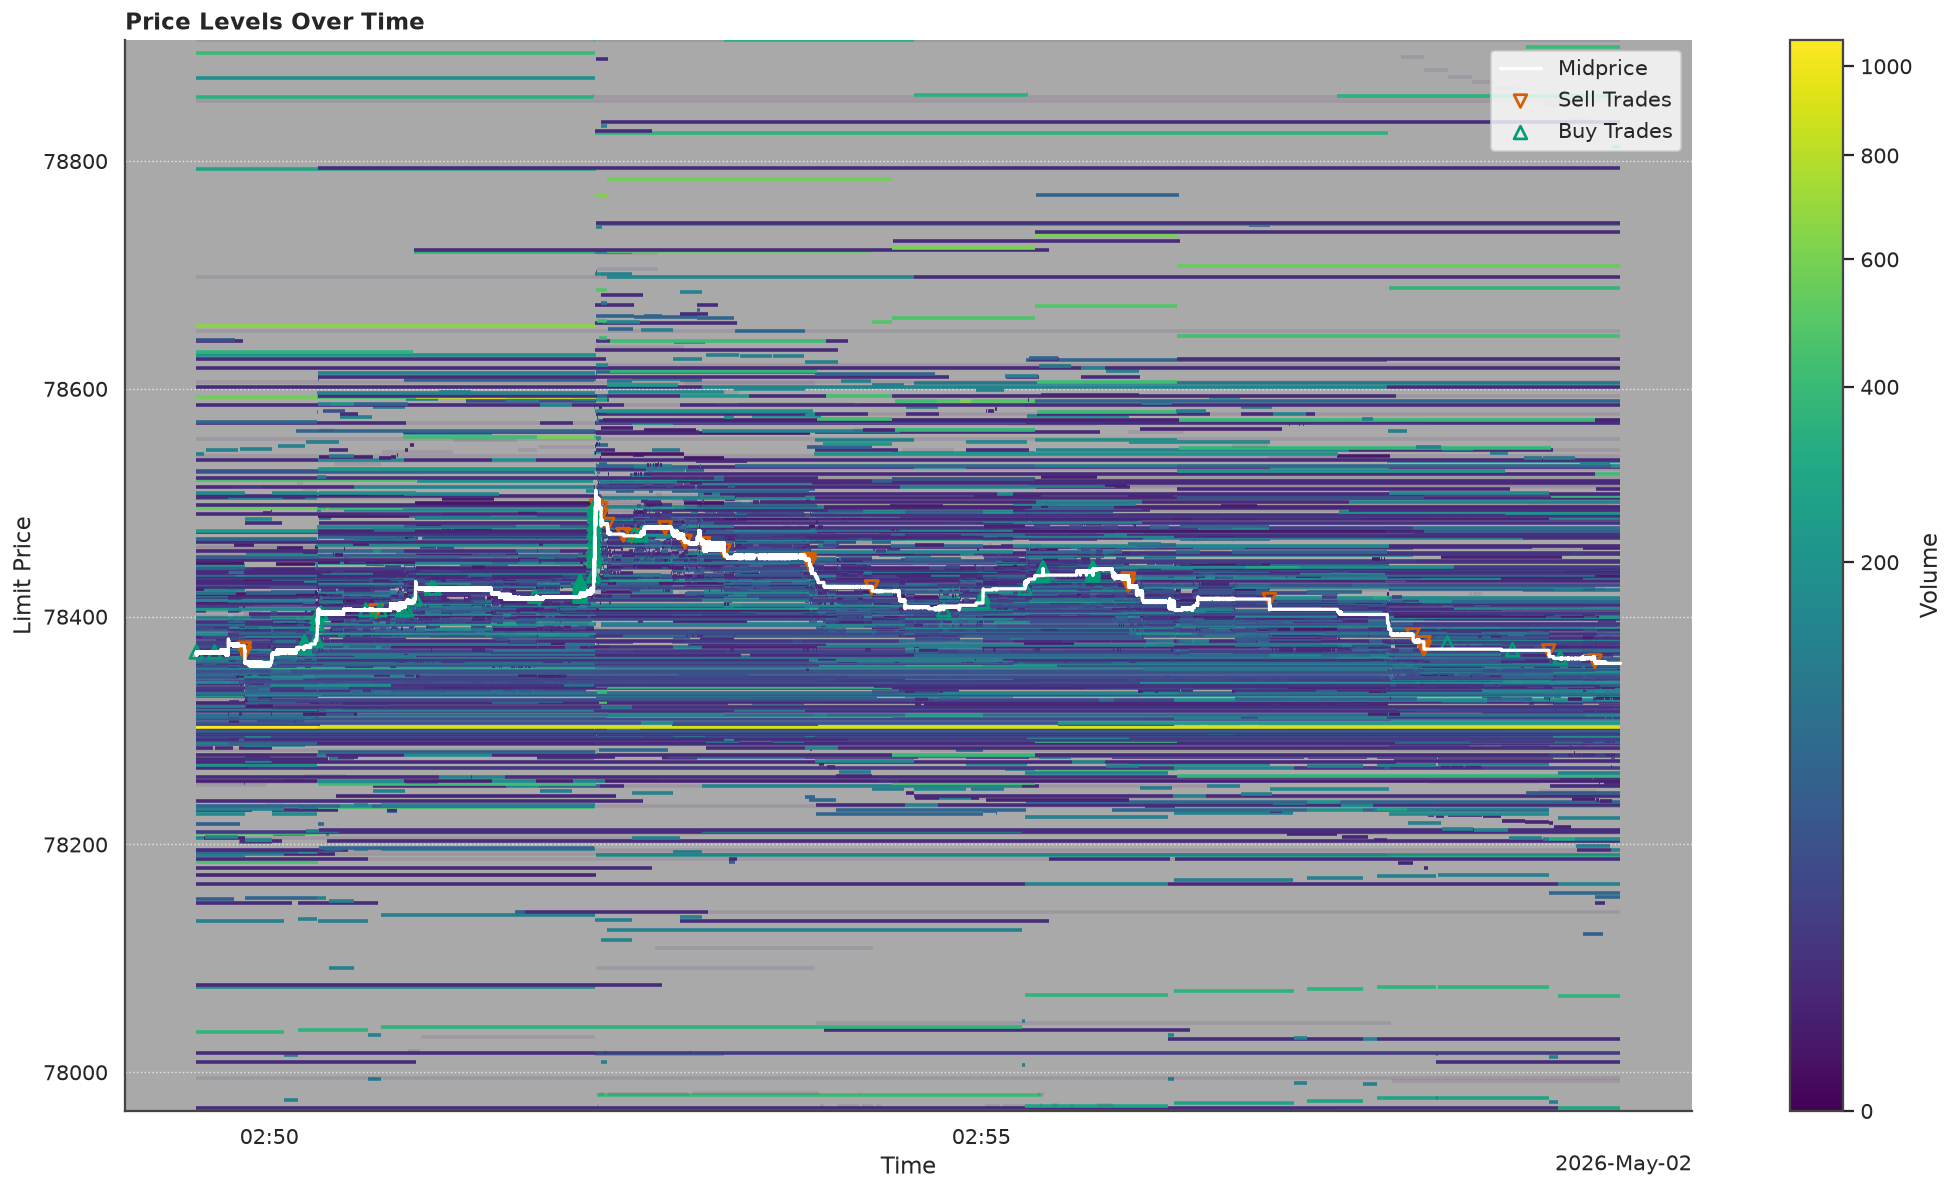
Resting volume at each price level over time.
start, end = _window(result)
return plot(
    "depth_heatmap",
    level="L2",
    **prepare.price_levels(
        result.depth,
        spread=get_spread(result.depth_summary),
        trades=result.trades,
        col_bias=0.4,
        start_time=start,
        end_time=end,
    ),
)
Book snapshot (L3)
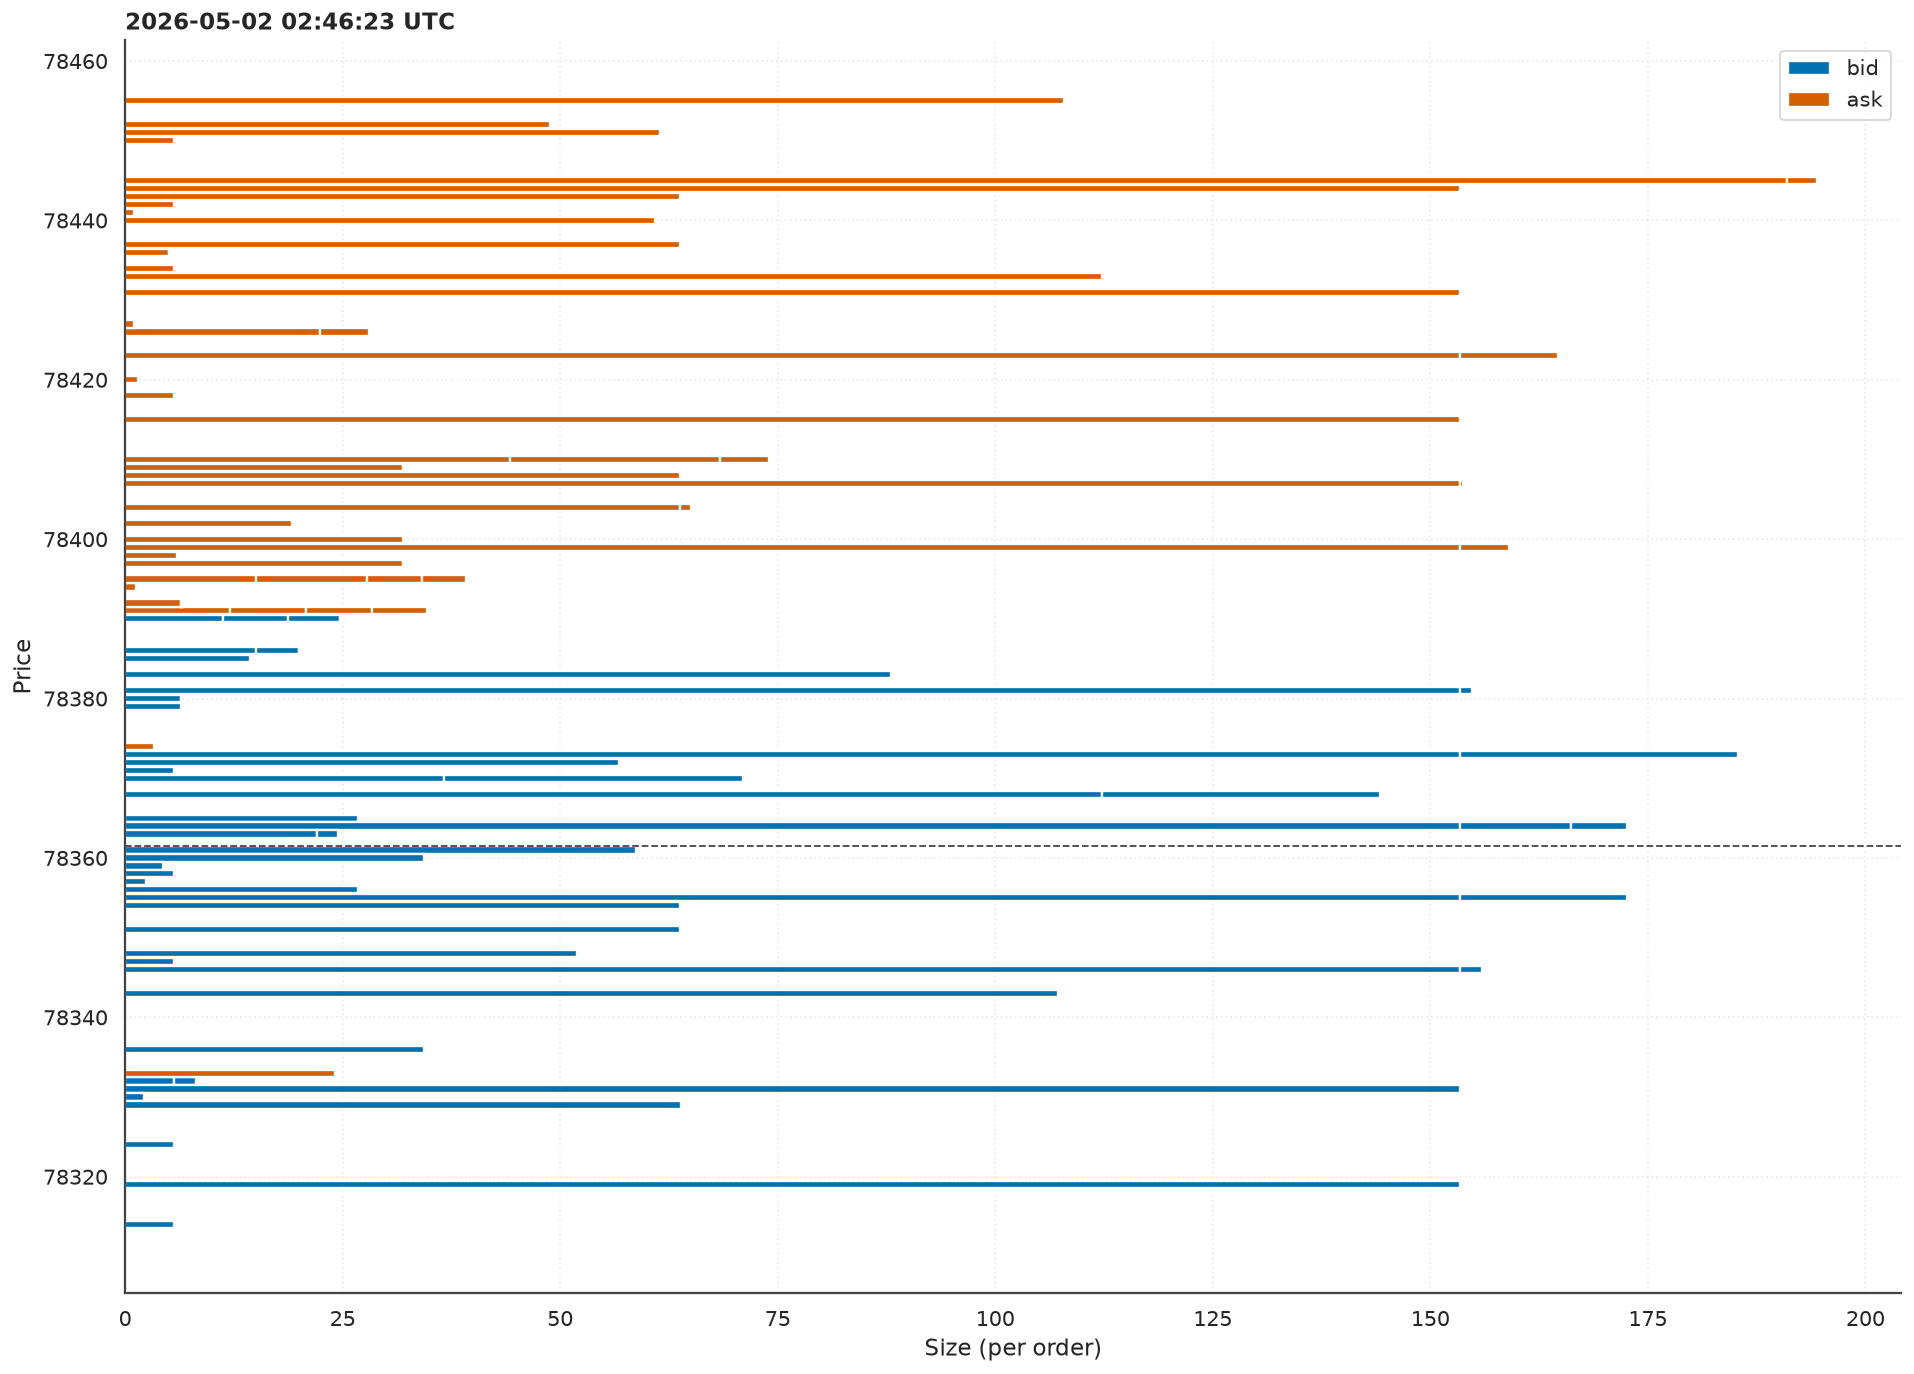
The bid/ask book at a single timestamp, one bar per resting order.
tp = result.events["timestamp"].iloc[0] + pd.Timedelta(minutes=10)
snap = order_book(result.events, tp=tp)
return plot(
    "book_snapshot", level="L3", **prepare.book_snapshot(snap, per_order=True)
)
Depth chart
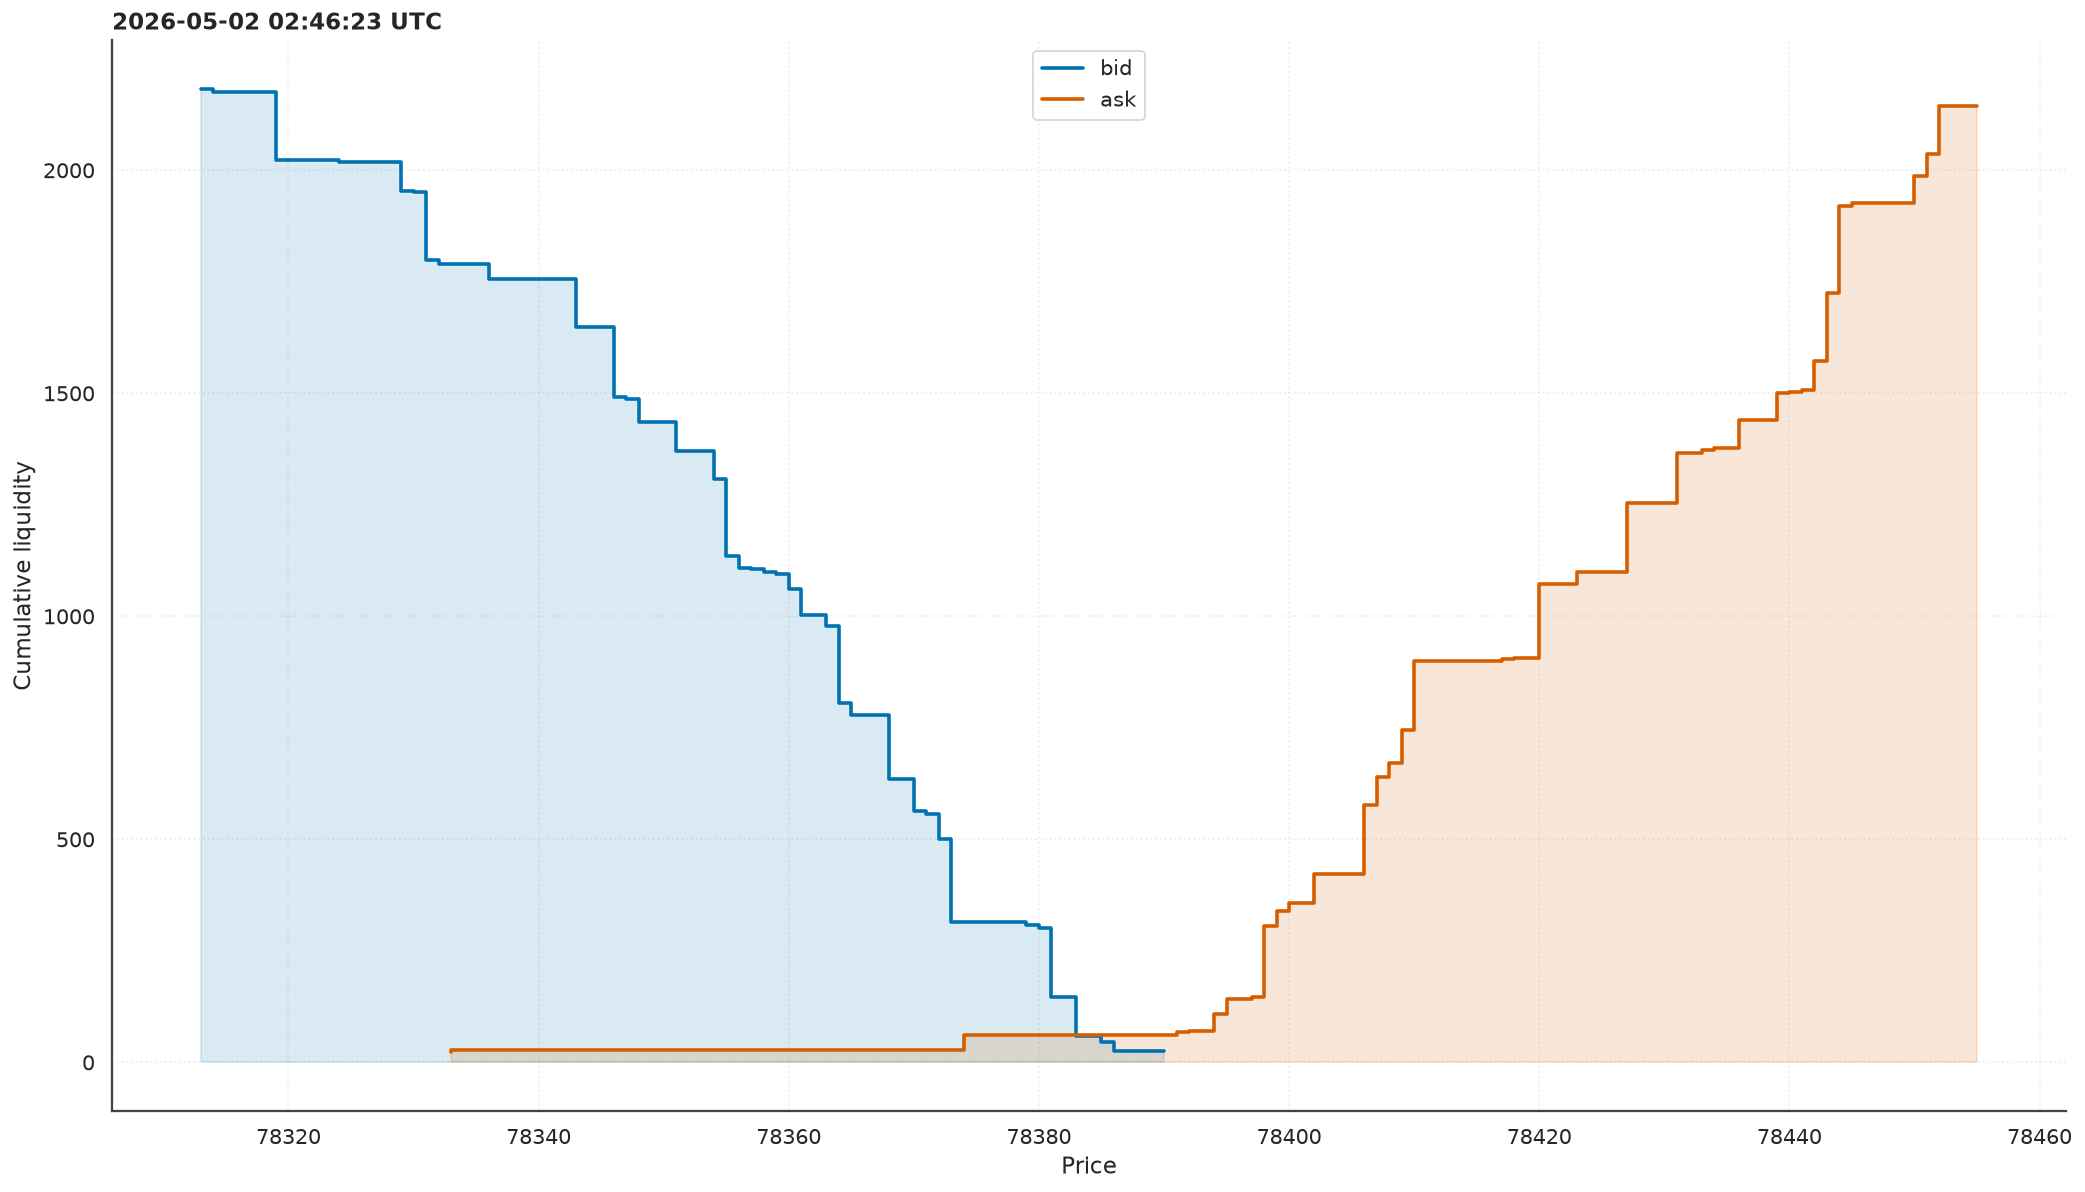
Cumulative resting volume by price, bids left, asks right.
tp = result.events["timestamp"].iloc[0] + pd.Timedelta(minutes=10)
snap = order_book(result.events, tp=tp)
return plot("depth_chart", level="L2", **prepare.book_snapshot(snap))
Trades
Trade tape
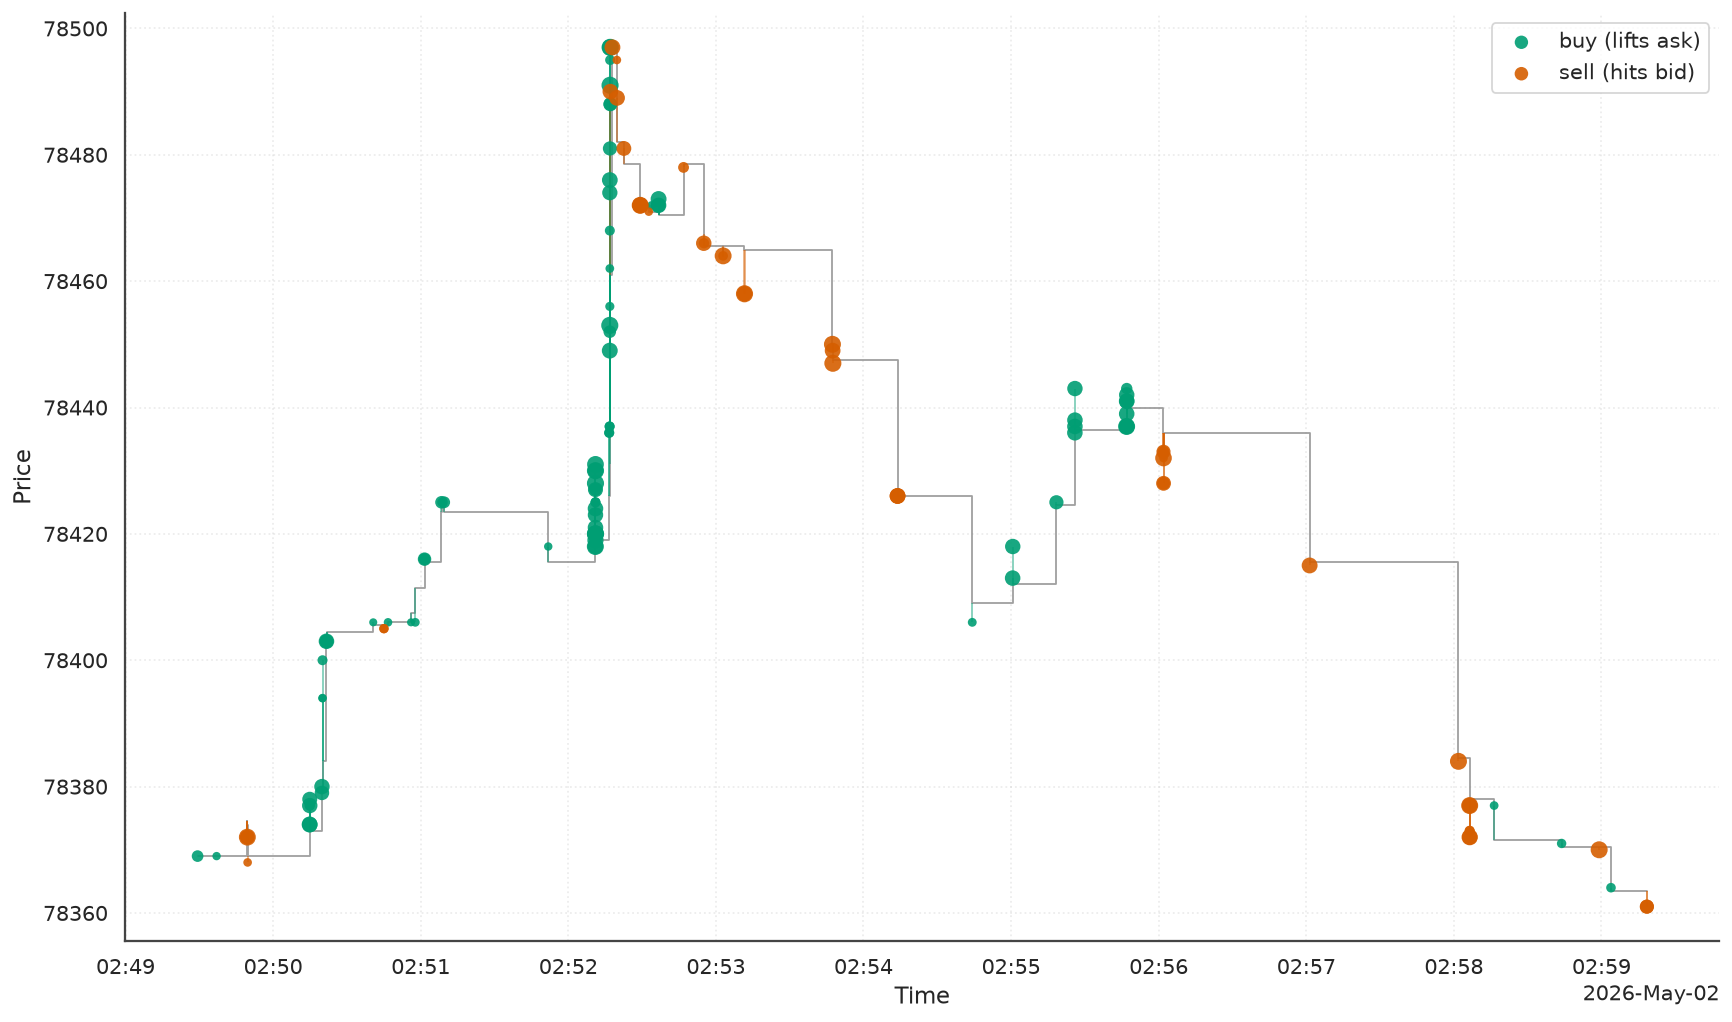
Executions against the mid price, marked by aggressor side.
start, end = _window(result)
return plot(
    "trade_tape",
    level="L2",
    **prepare.trades(
        result.trades,
        spread=get_spread(result.depth_summary),
        start_time=start,
        end_time=end,
    ),
)
Liquidity
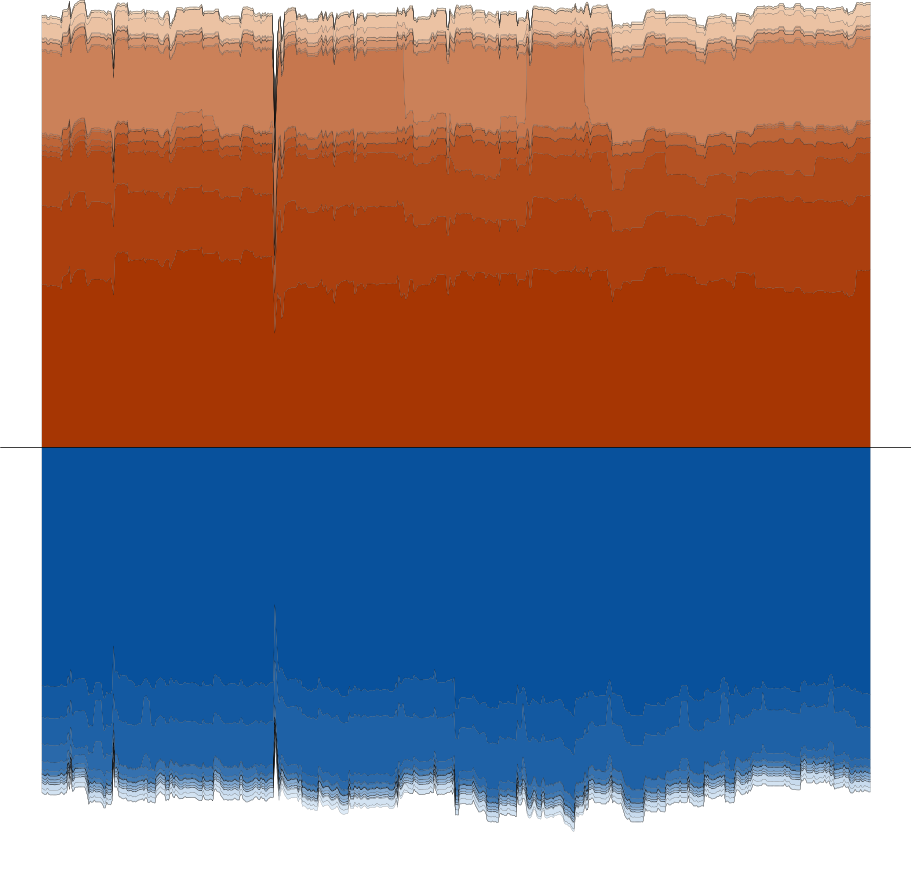
Volume percentiles
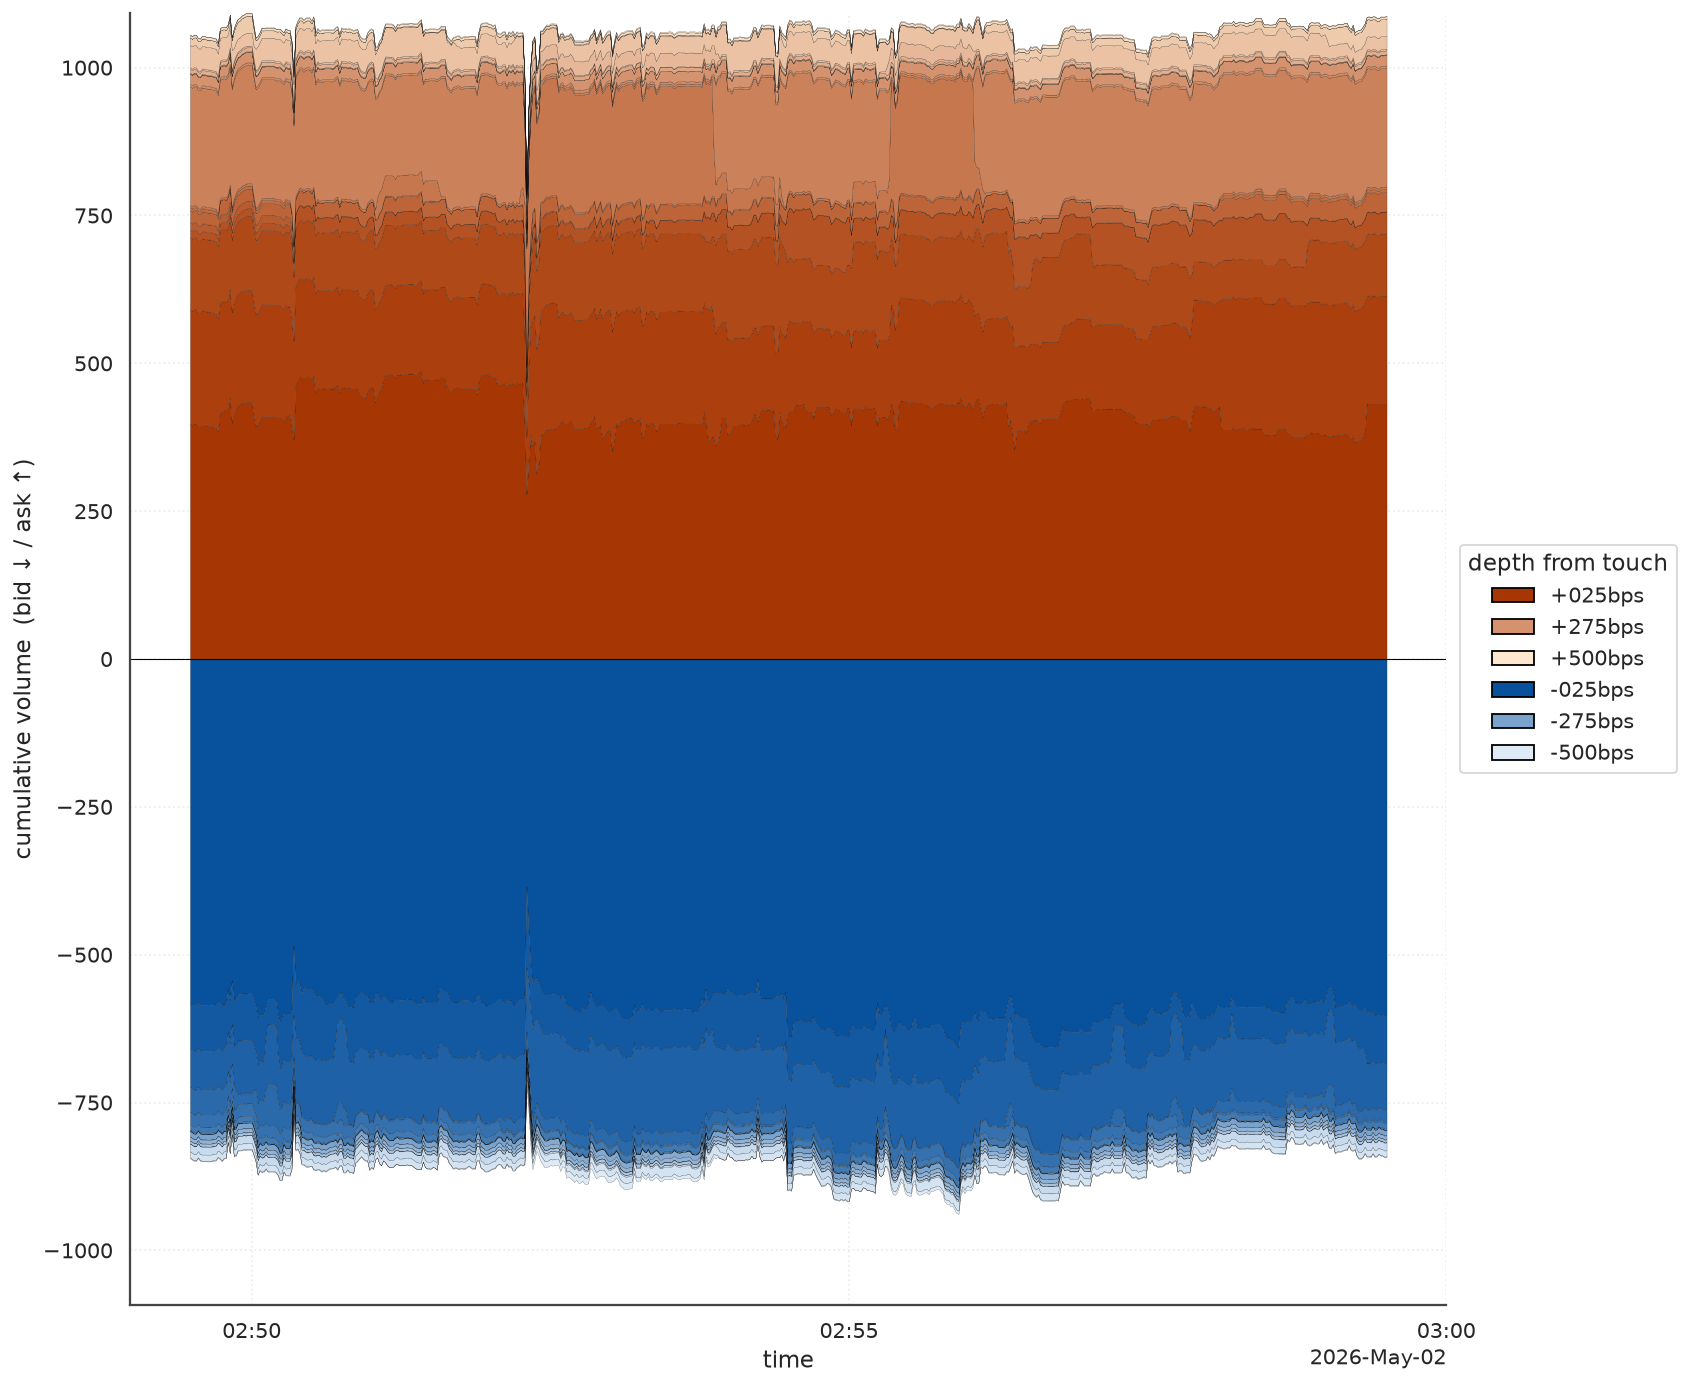
Cumulative resting volume in basis-point bands around the mid.
start, end = _window(result)
return plot(
    "volume_percentiles",
    level="L2",
    **prepare.volume_percentiles(
        result.depth_summary, start_time=start, end_time=end
    ),
)
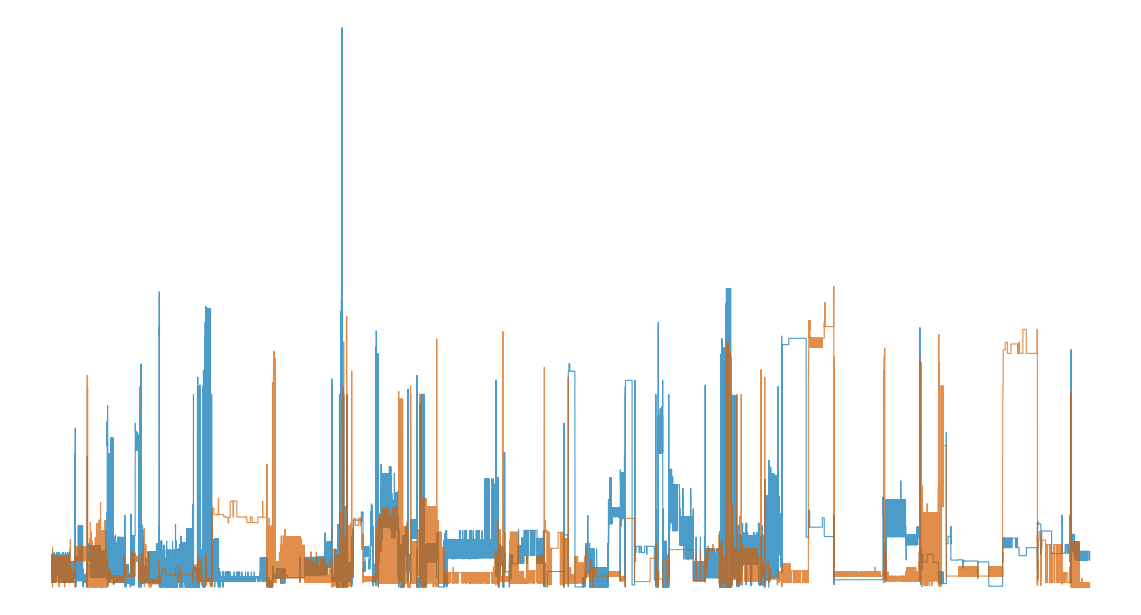
Liquidity at touch
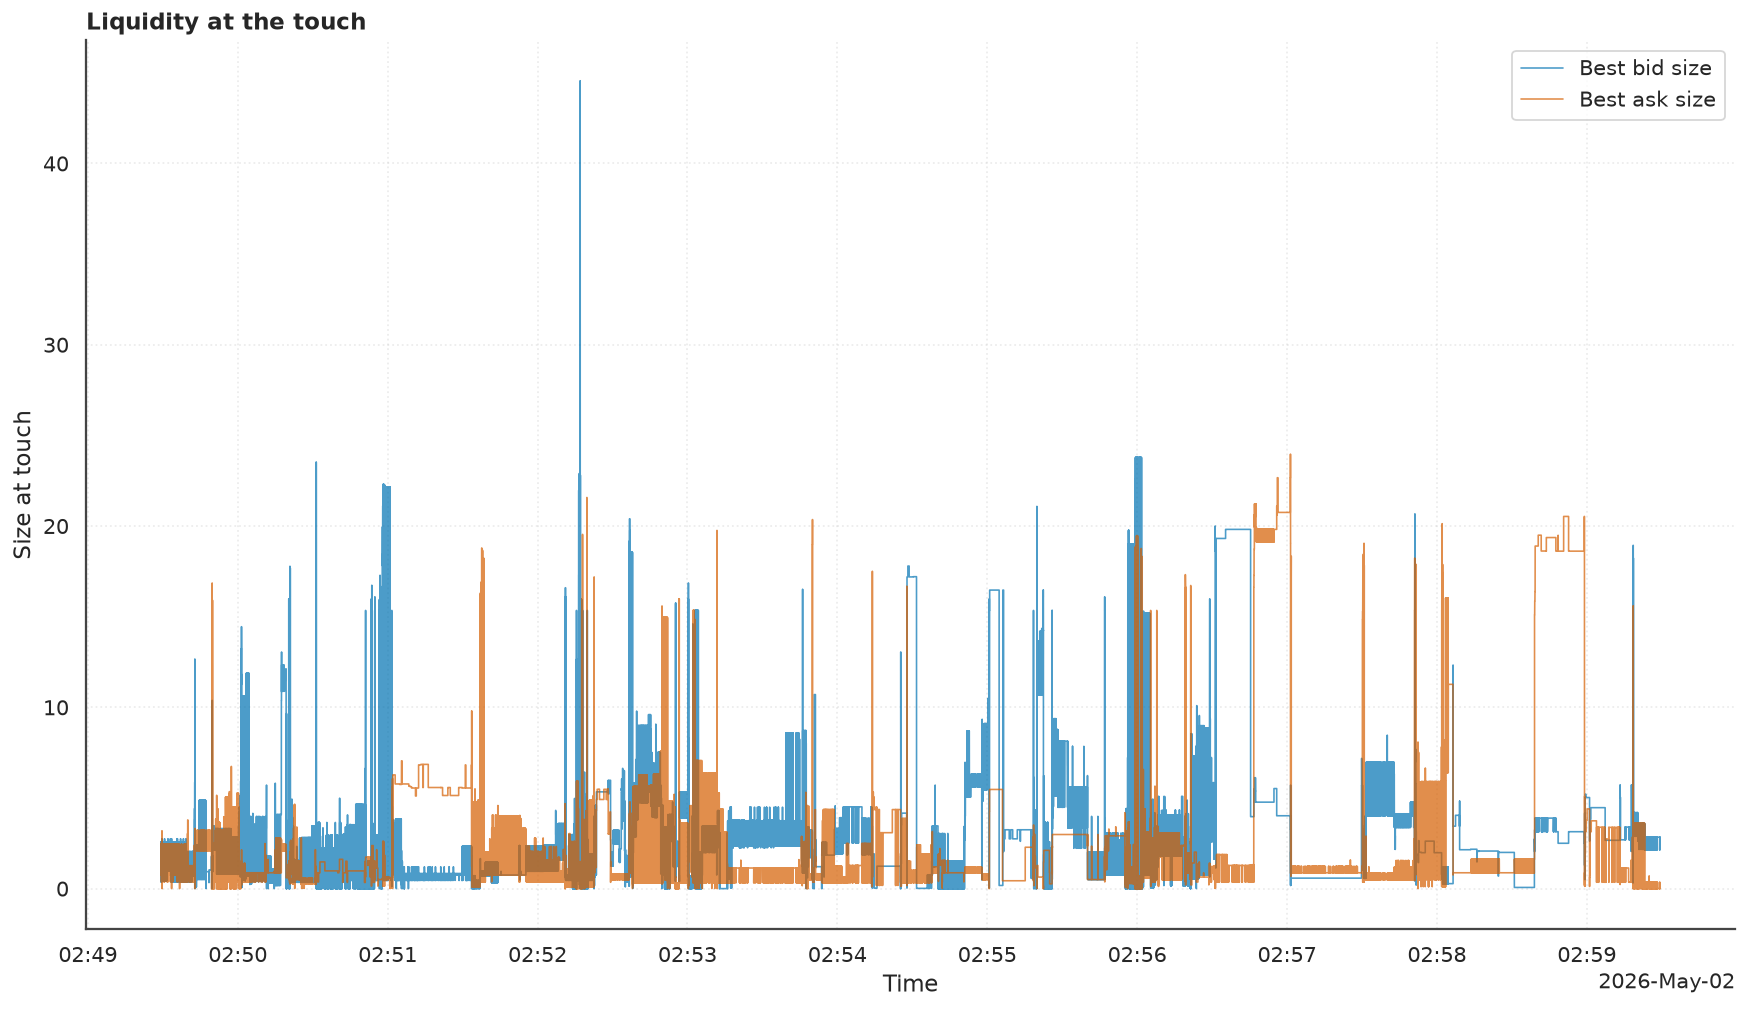
Resting volume at the best bid and ask over time.
start, end = _window(result)
return plot(
    "liquidity_at_touch",
    level="L2",
    **prepare.liquidity_at_touch(
        result.depth_summary, start_time=start, end_time=end
    ),
)
Order lifecycles
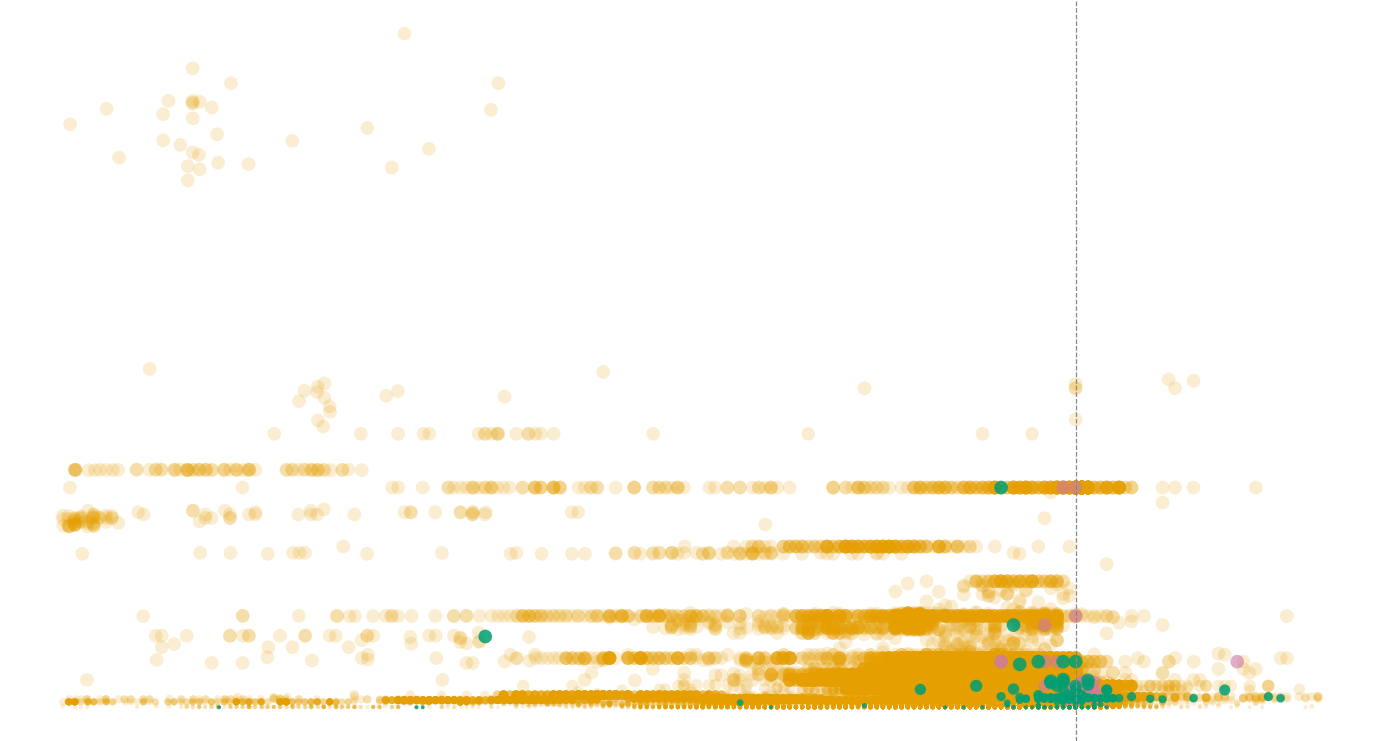
Order outcomes (L3)
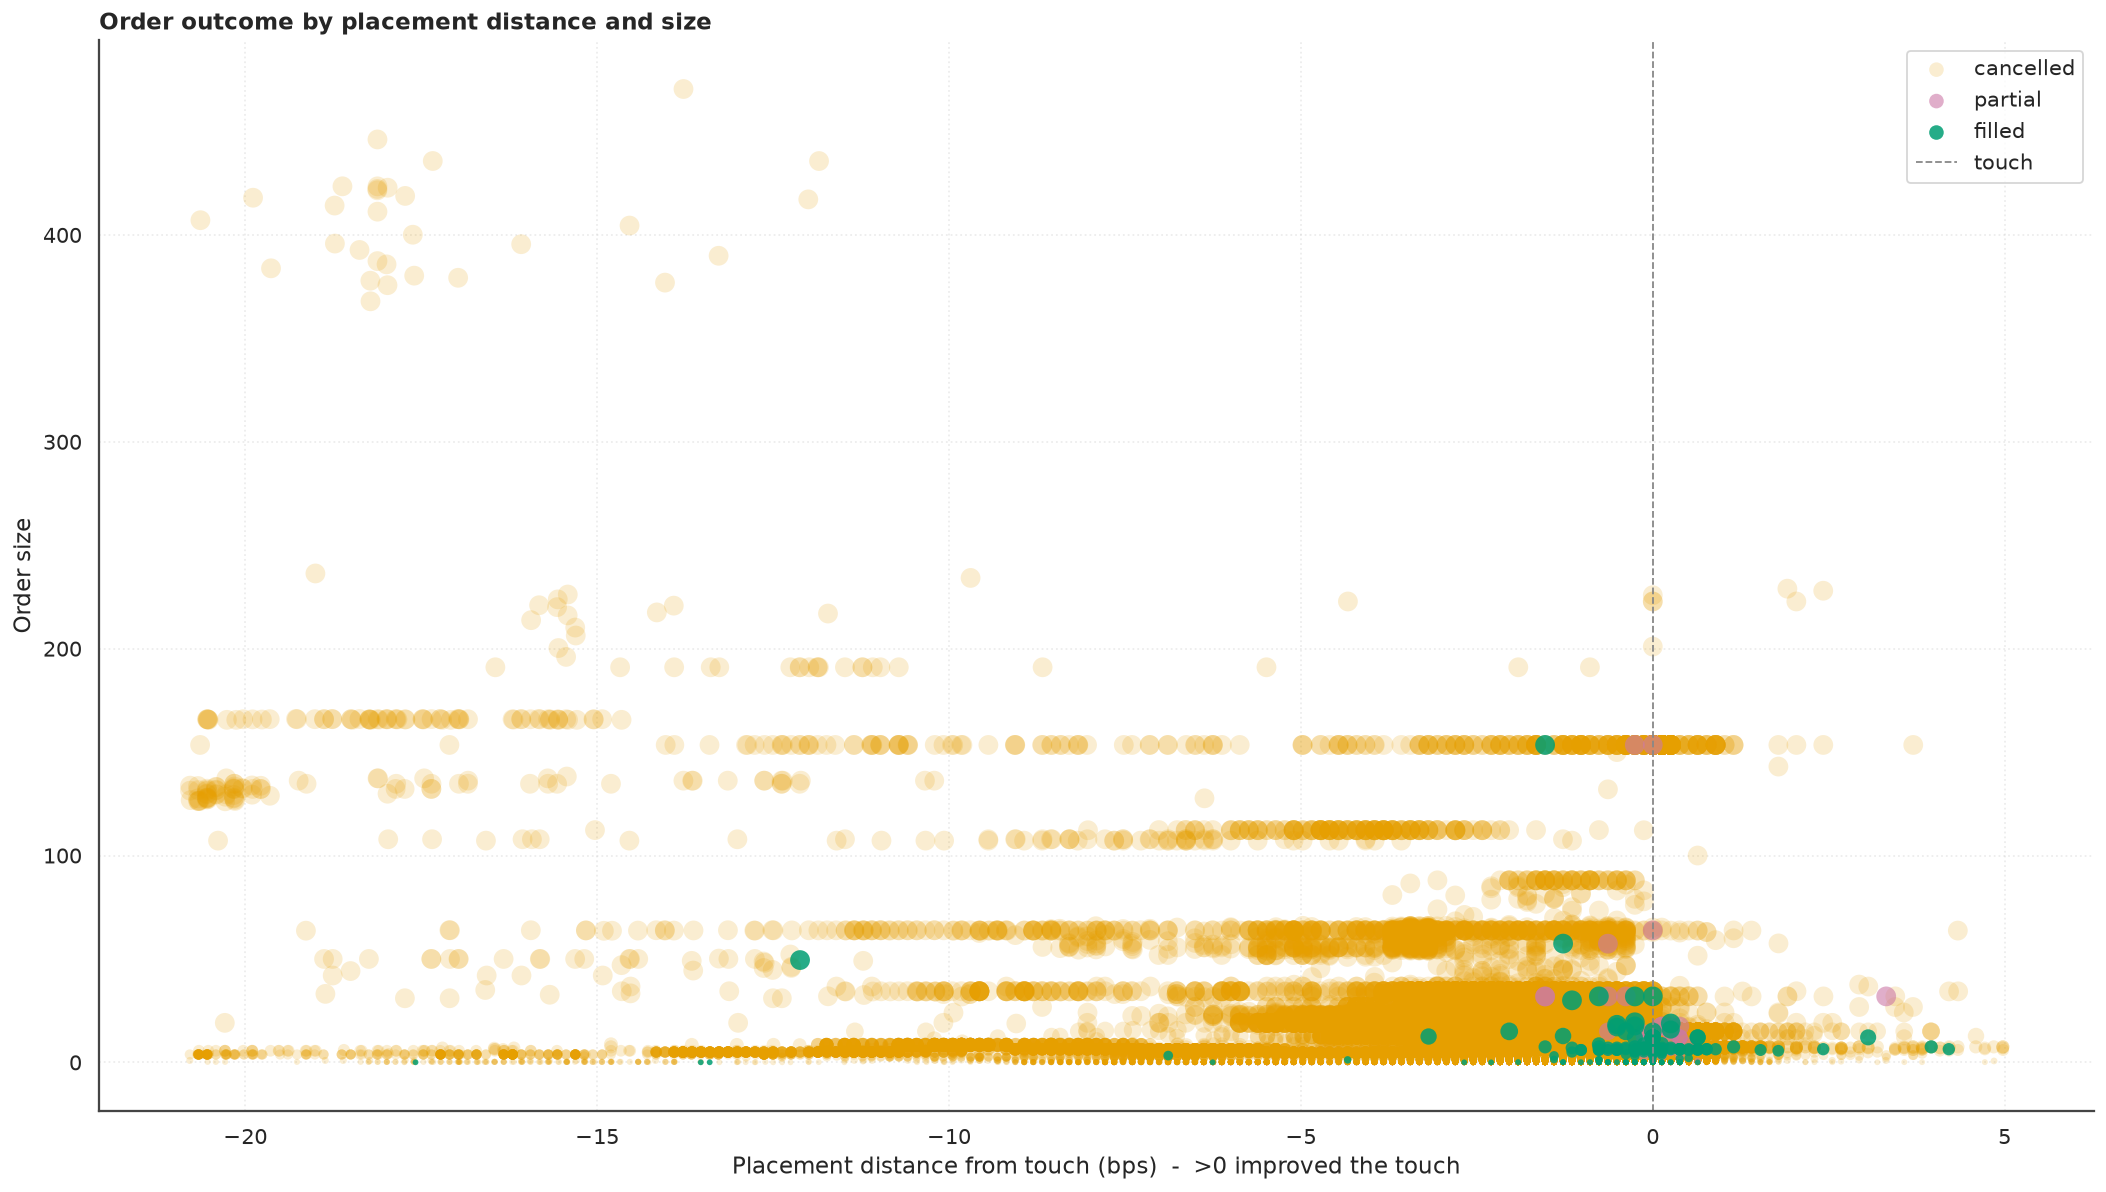
Orders by placement distance and size, coloured by outcome.
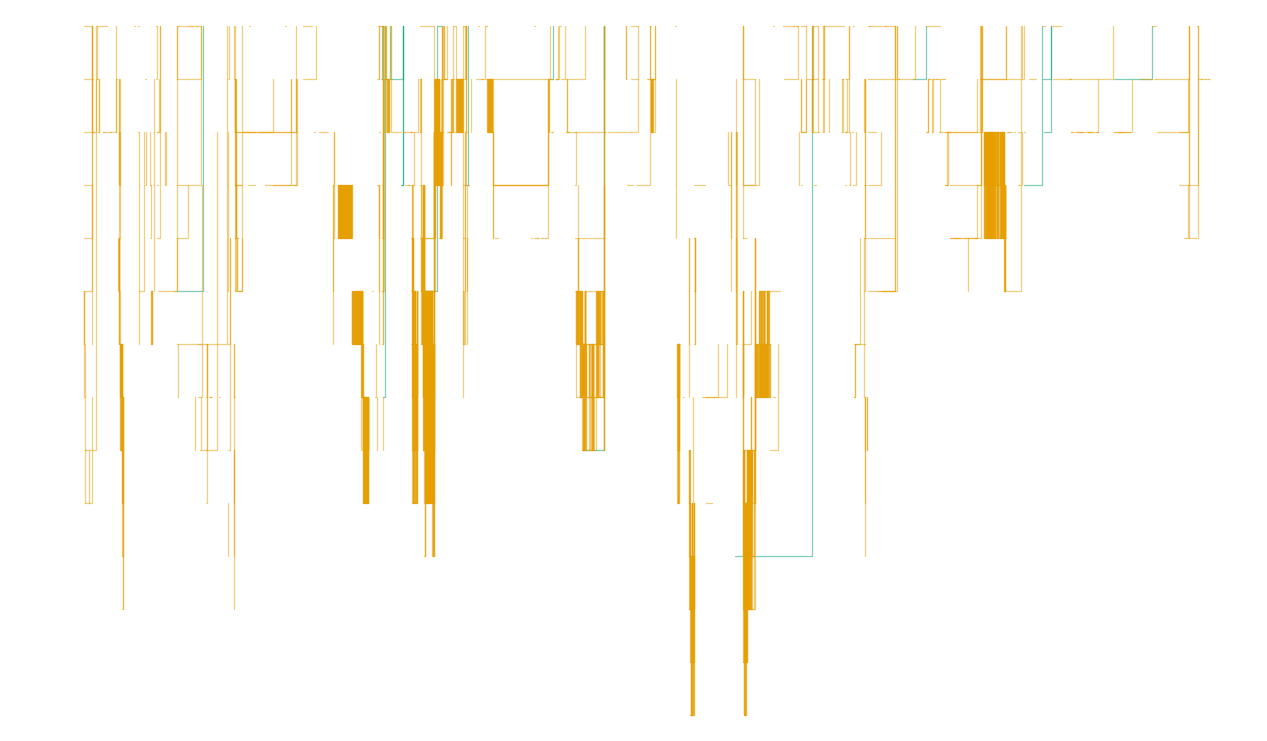
Queue position (L3)
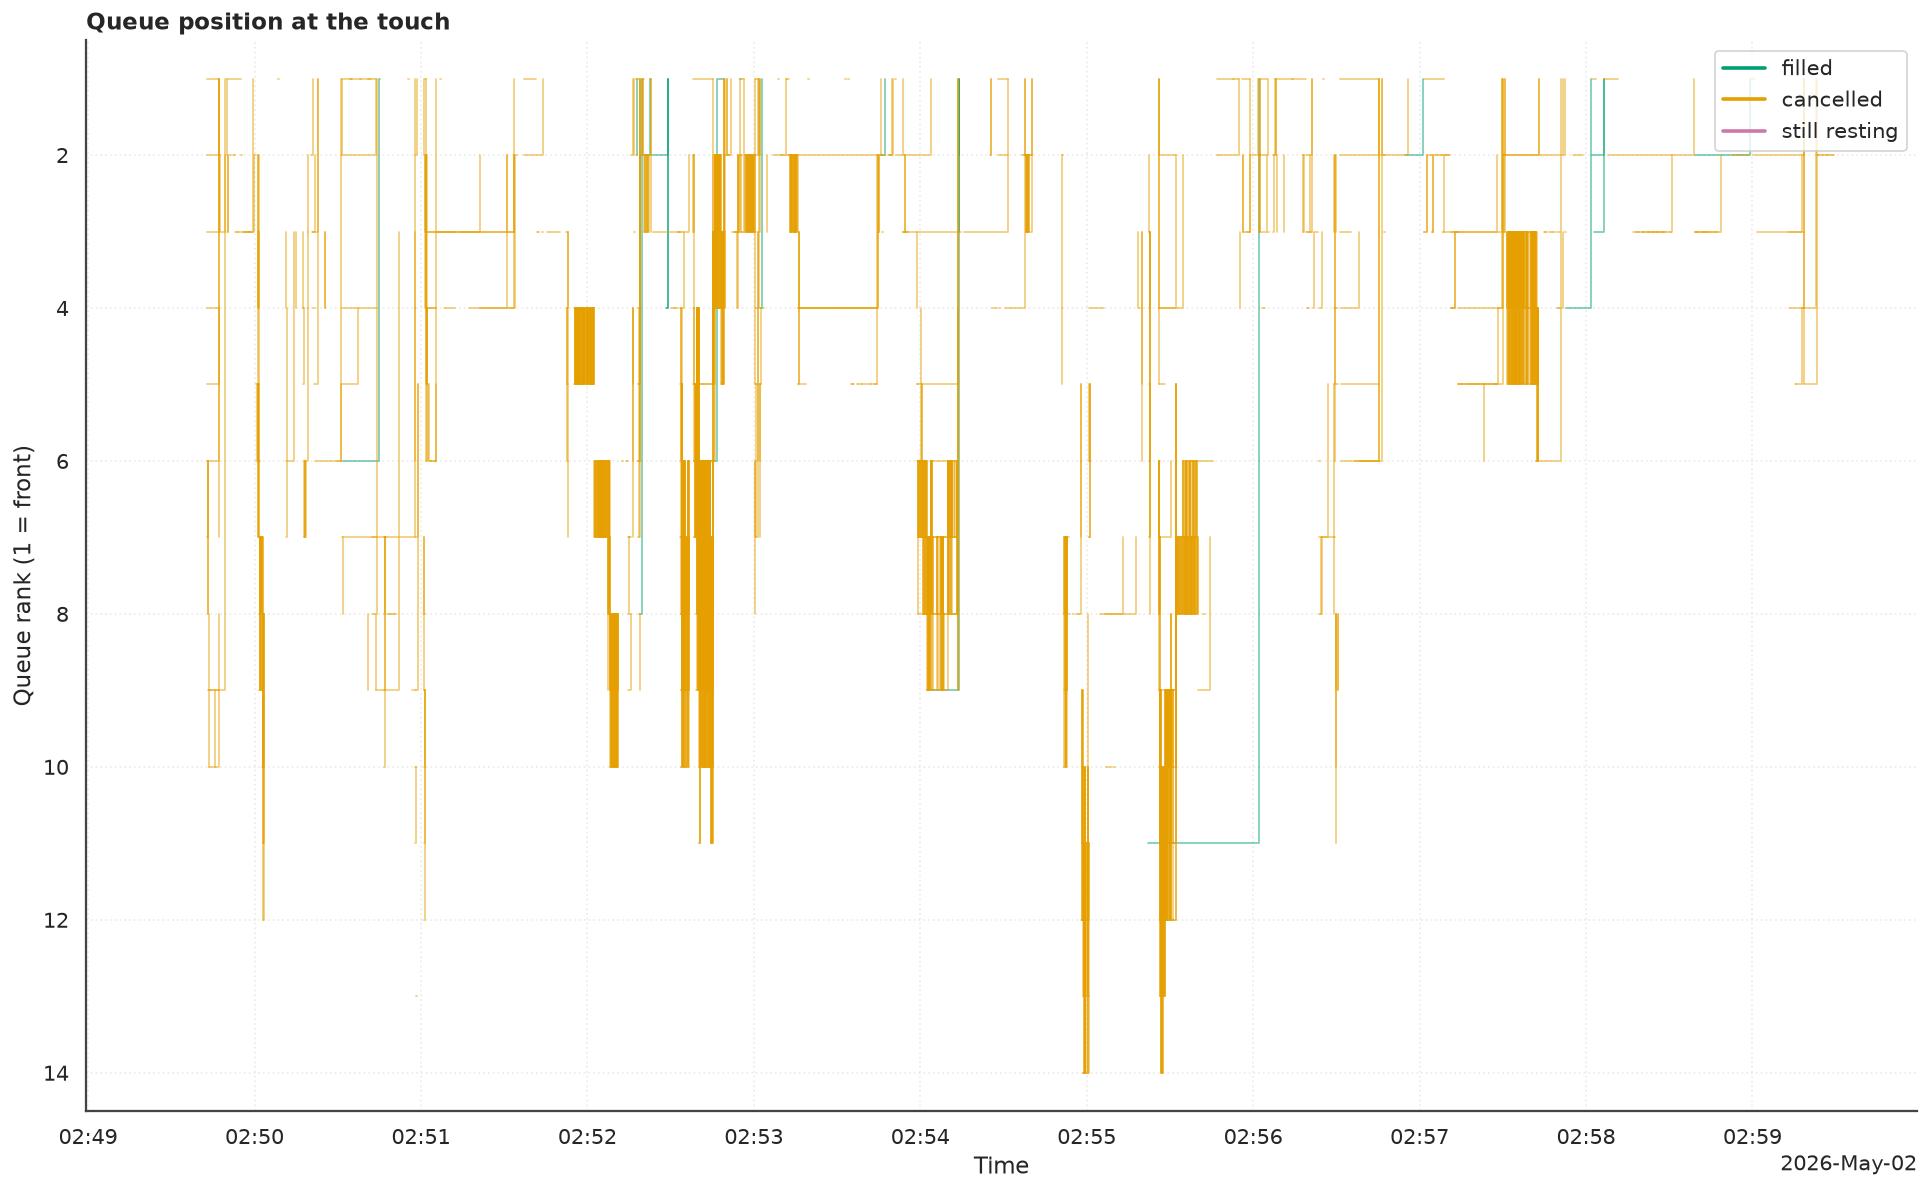
Each order's FIFO rank at the touch over time.
start, end = _window(result)
return plot(
    "queue_position",
    level="L3",
    **prepare.queue_position_l3(result.events, start_time=start, end_time=end),
)
Cancellations (L3)
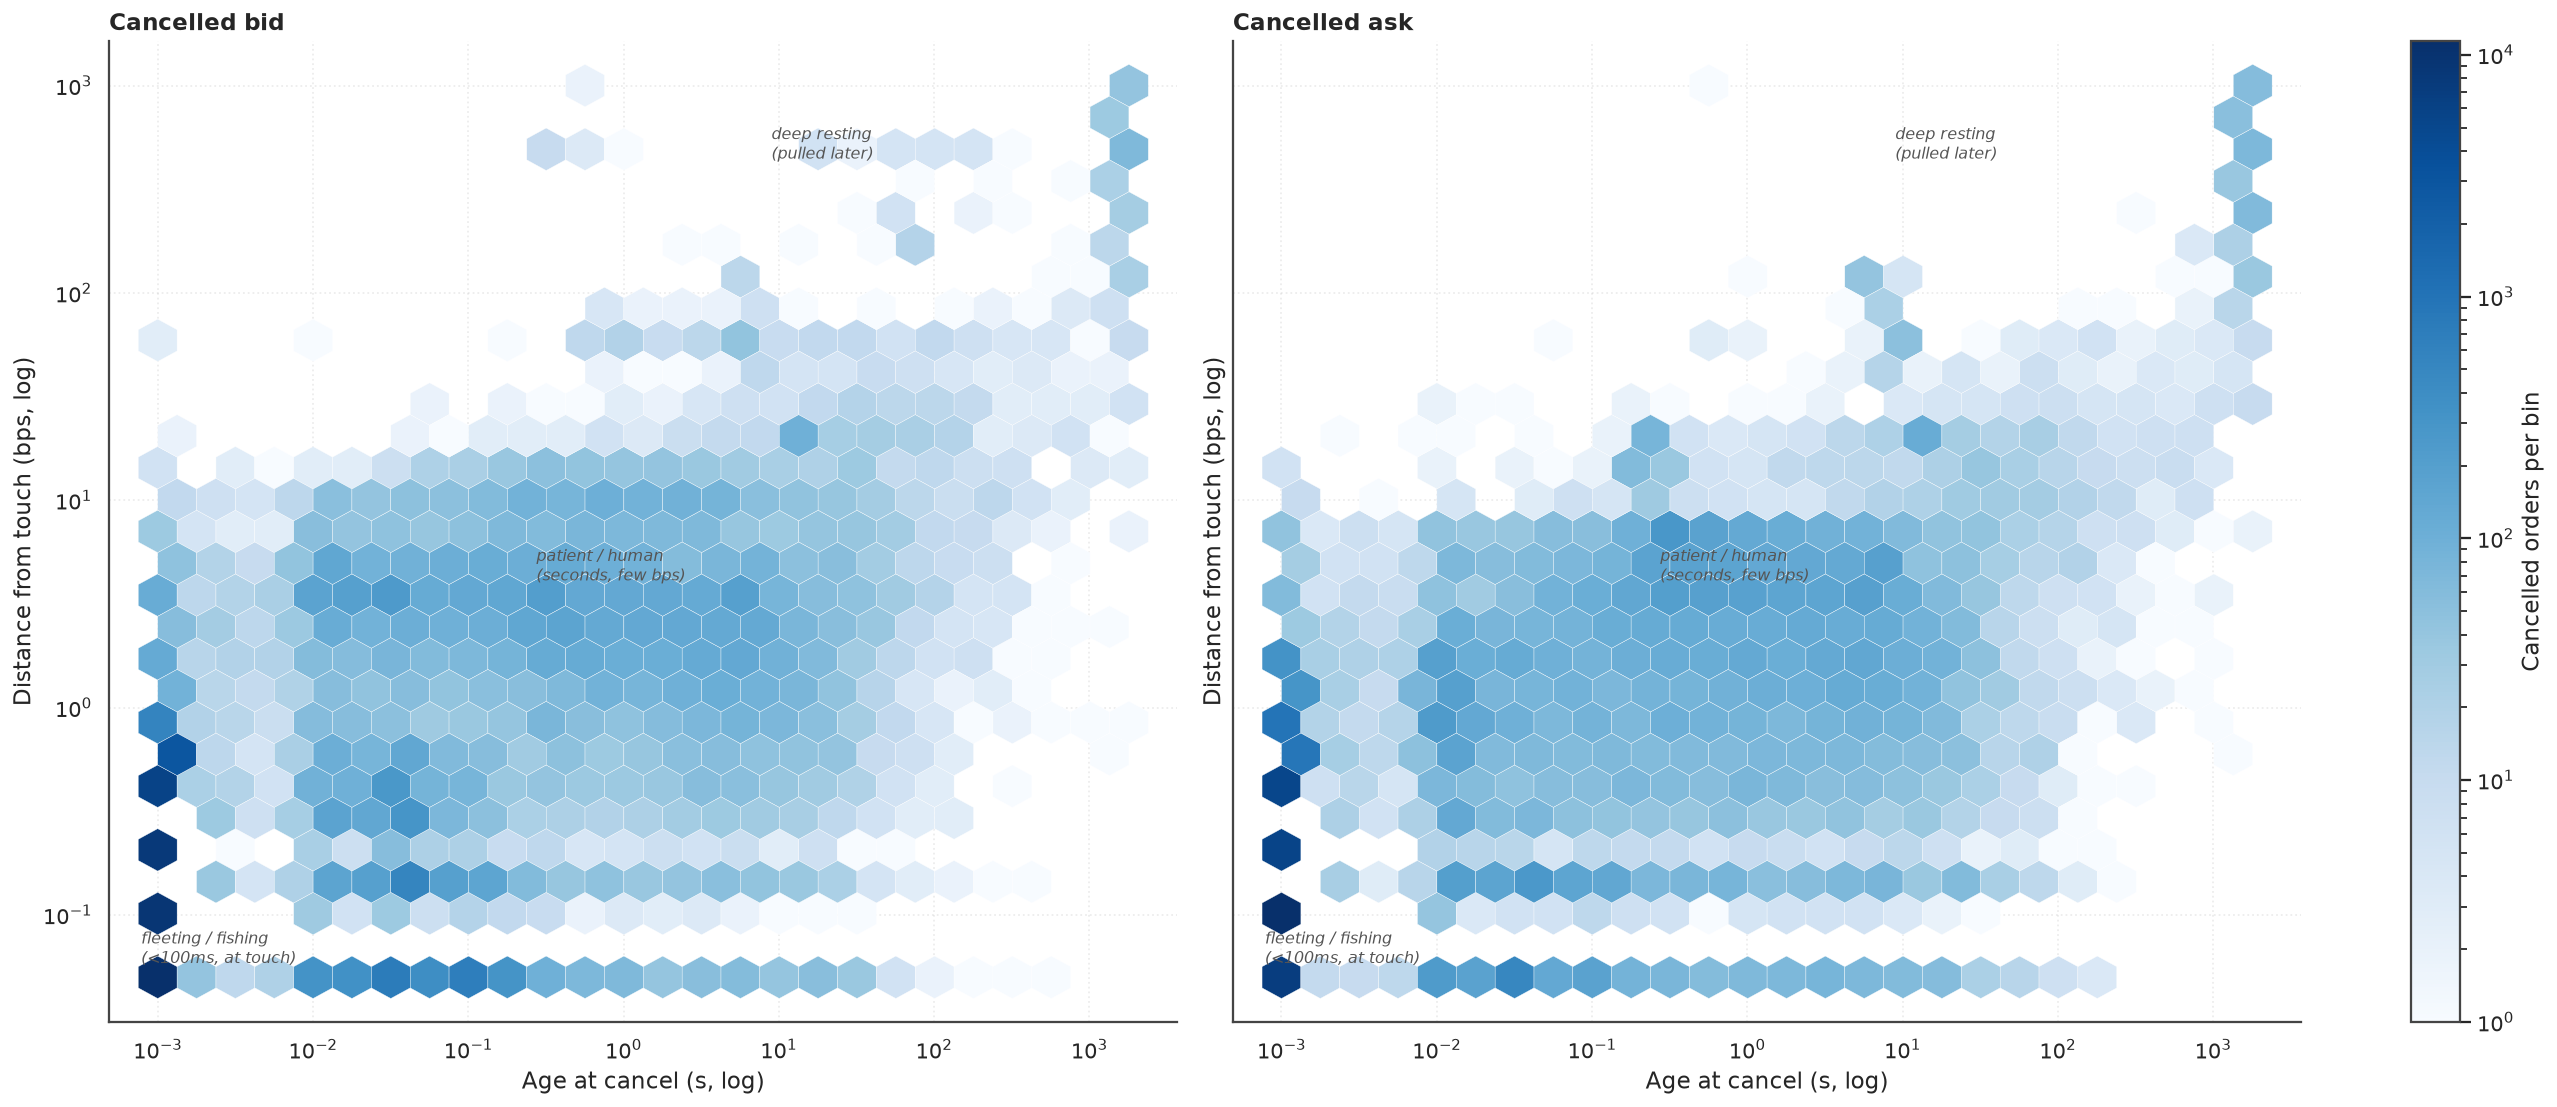
Cancellations by age and distance from the touch.
Flow toxicity
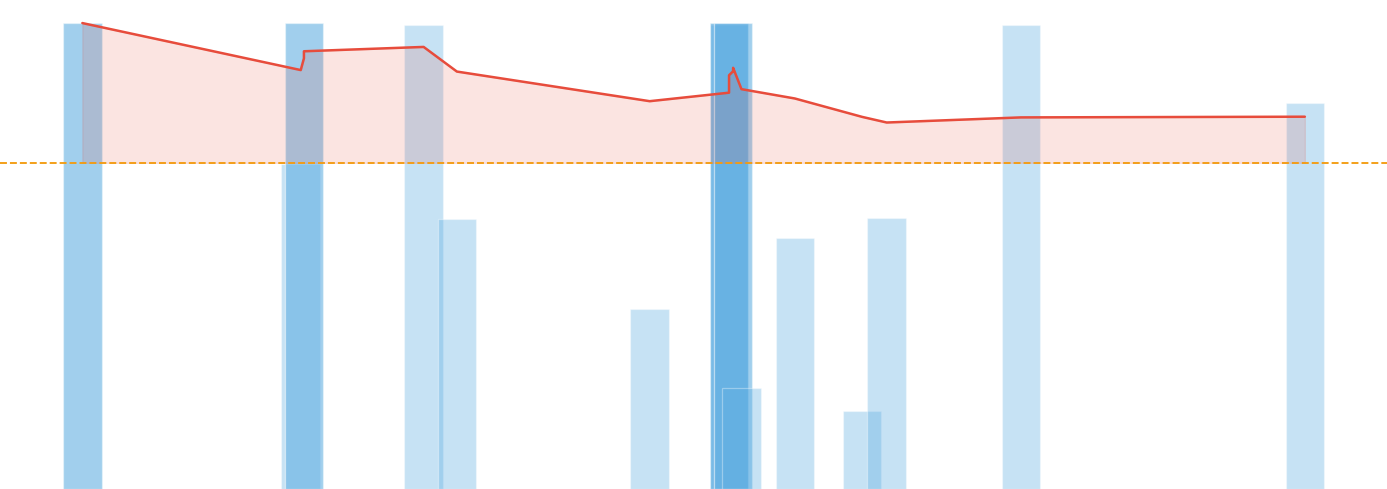
VPIN
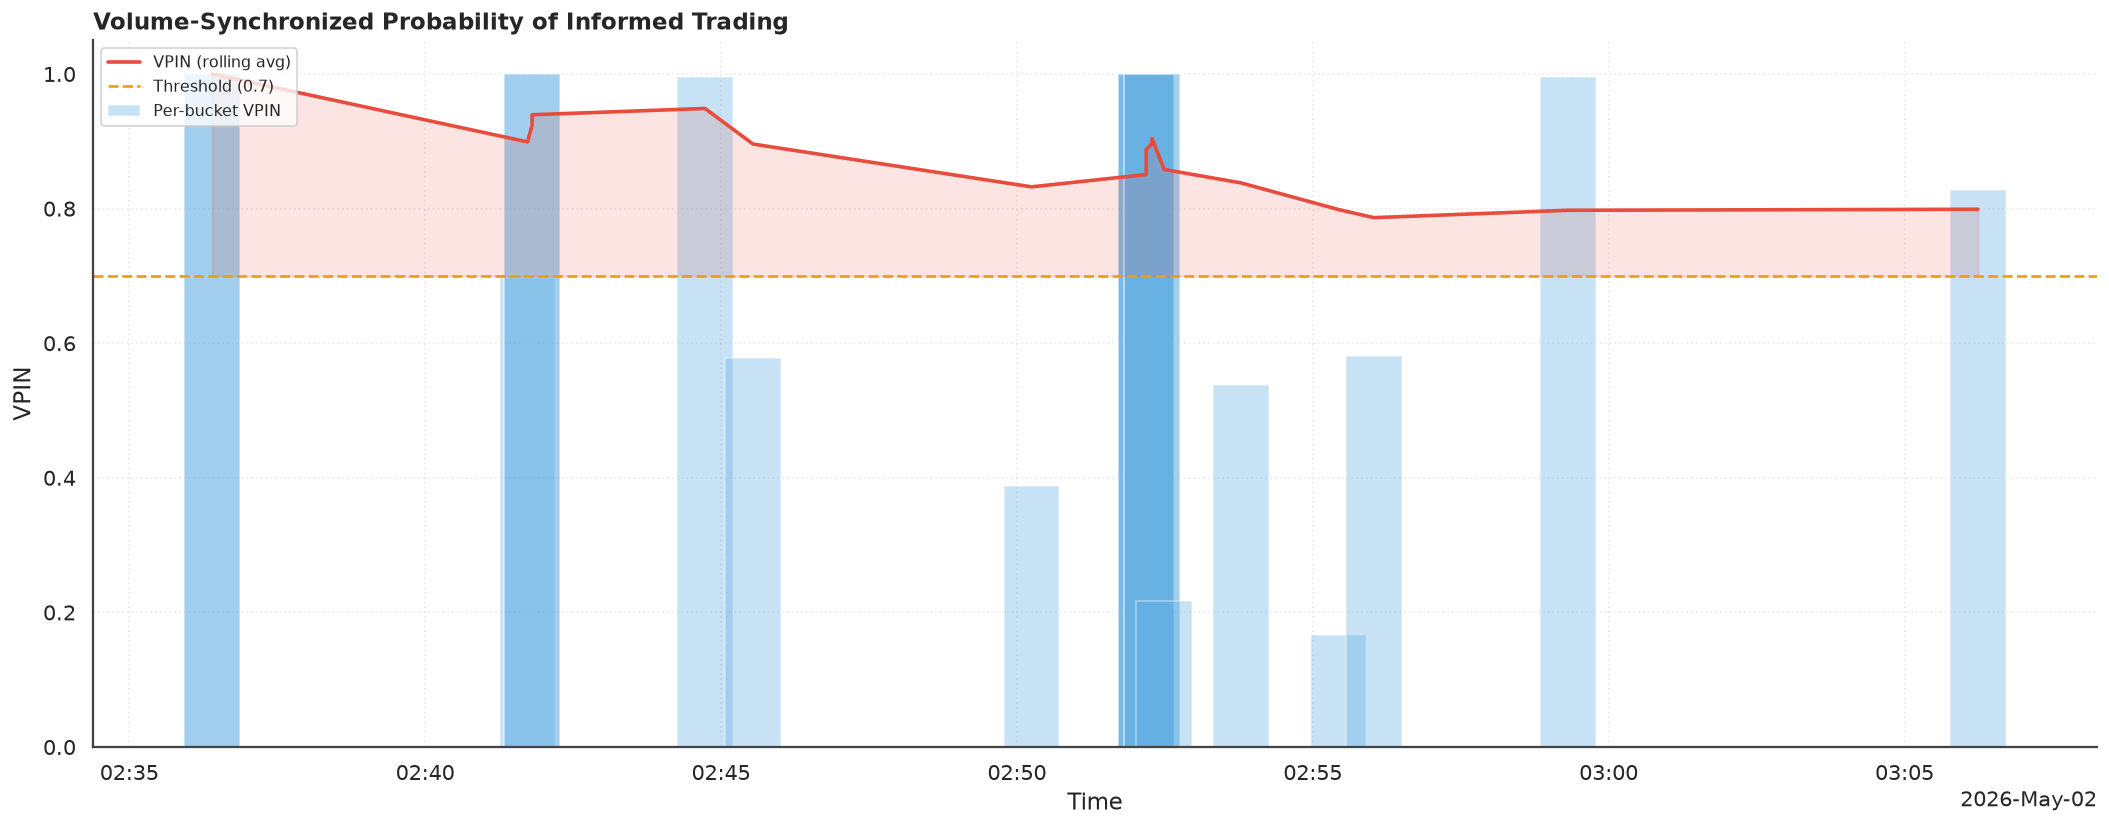
Volume-synchronised probability of informed trading.
# Twenty buckets over the session, averaged ten at a time: the default
# 50-bucket window would never fill on a 30-minute sample.
v = compute_vpin(
    result.trades, bucket_volume=result.trades["volume"].sum() / 20, n_buckets=10
)
return plot("vpin", **prepare.vpin(v, threshold=0.7))
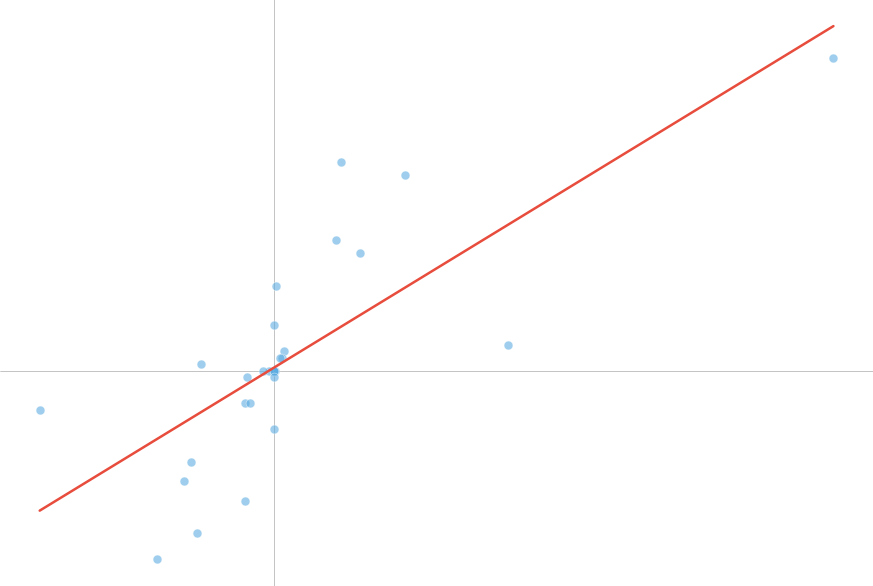
Kyle's lambda
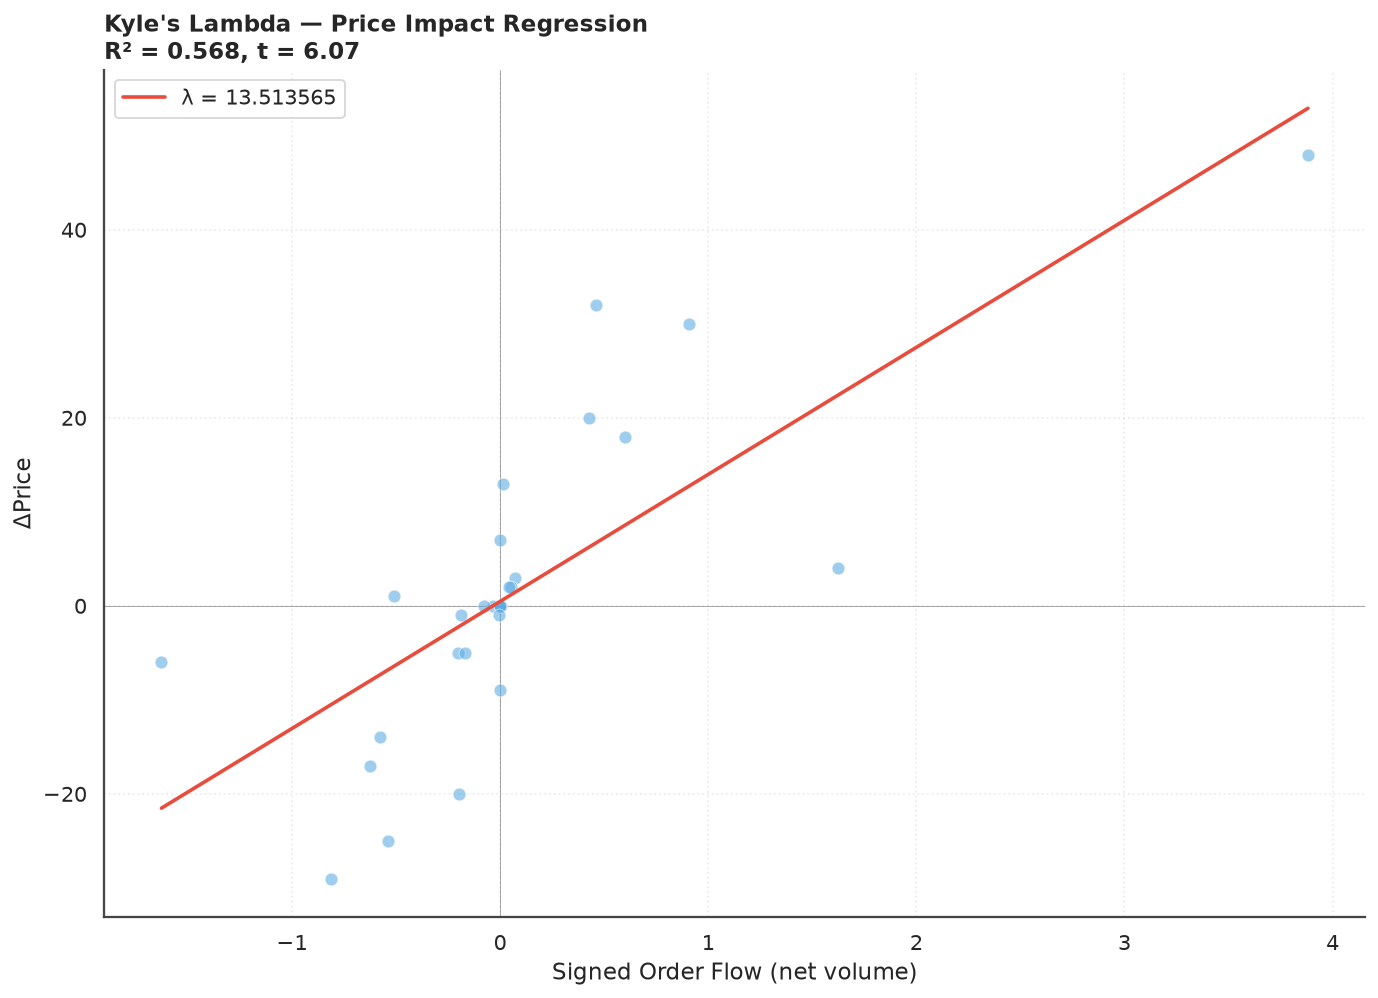
Price impact per unit of signed order flow.
# A short regression window gives more points, so the scatter reads as a
# cloud around the fit rather than a bare line.
return plot(
    "kyle_lambda",
    **prepare.kyle_lambda(compute_kyle_lambda(result.trades, window="1min")),
)
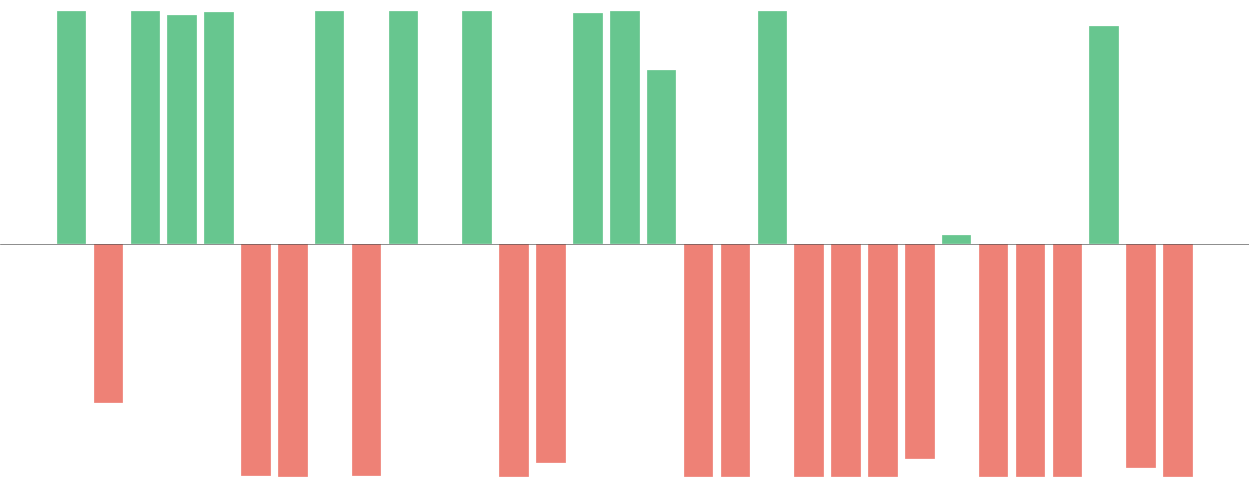
Order flow imbalance
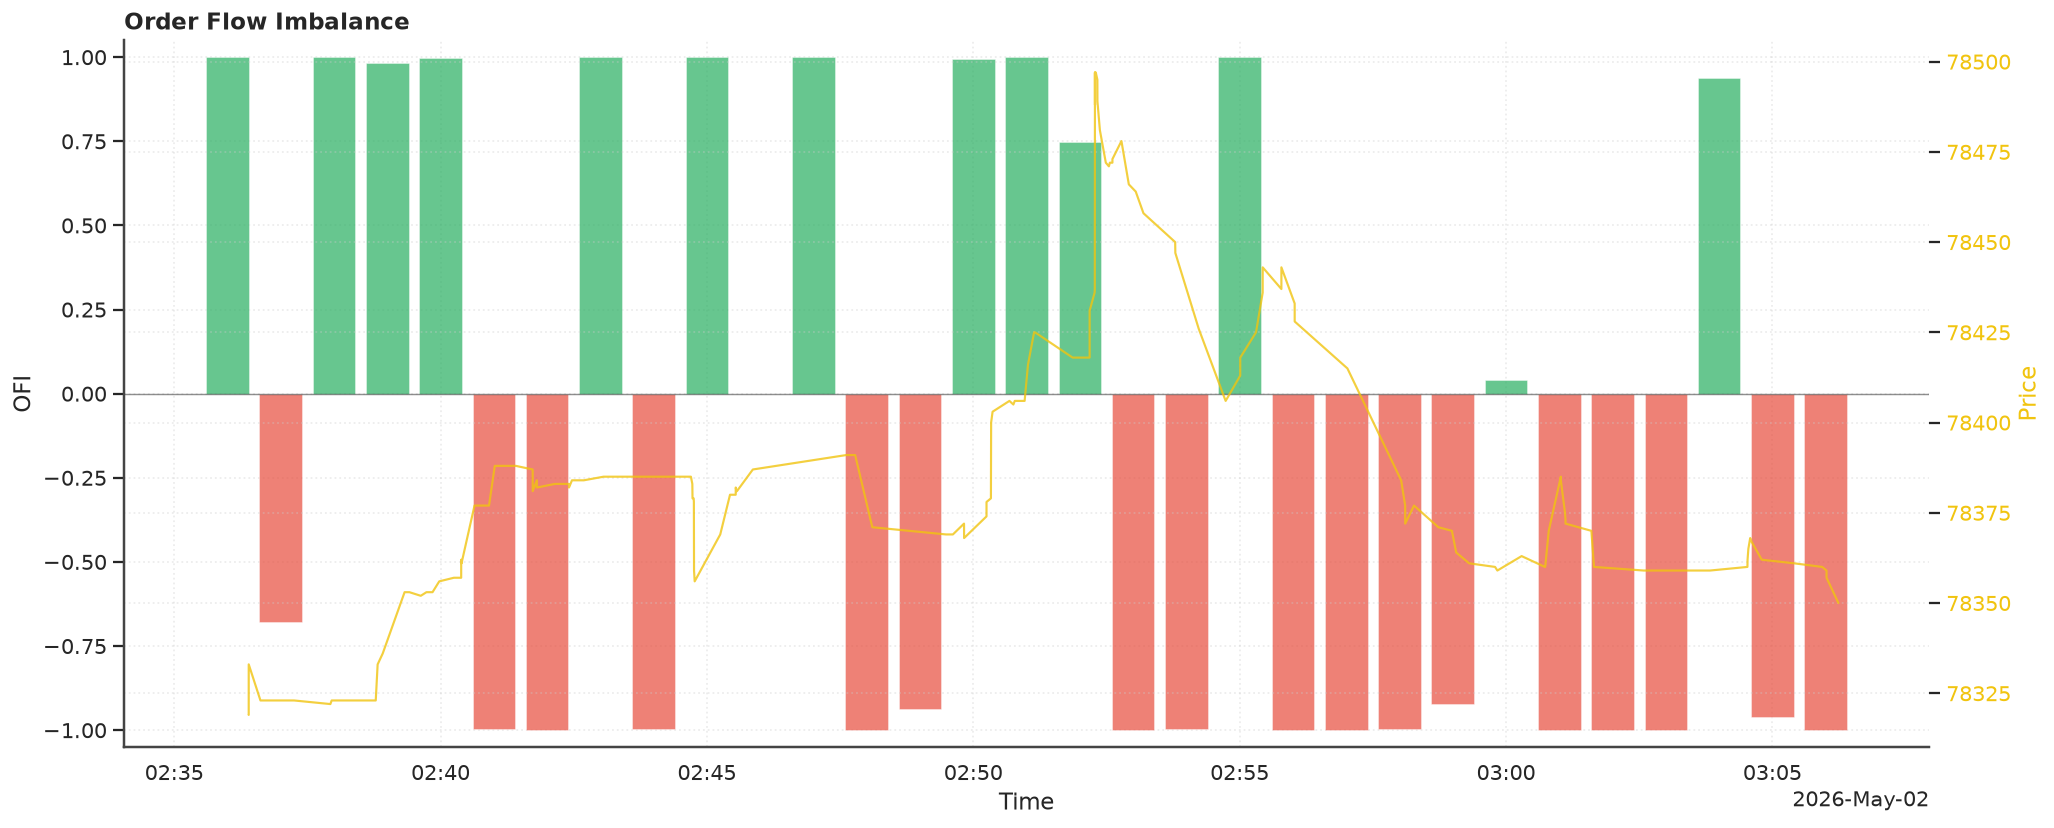
Net buy-minus-sell volume per minute.
ofi = order_flow_imbalance(result.trades, window="1min")
return plot("order_flow_imbalance", **prepare.ofi(ofi, trades=result.trades))
Transaction cost
Transaction costs
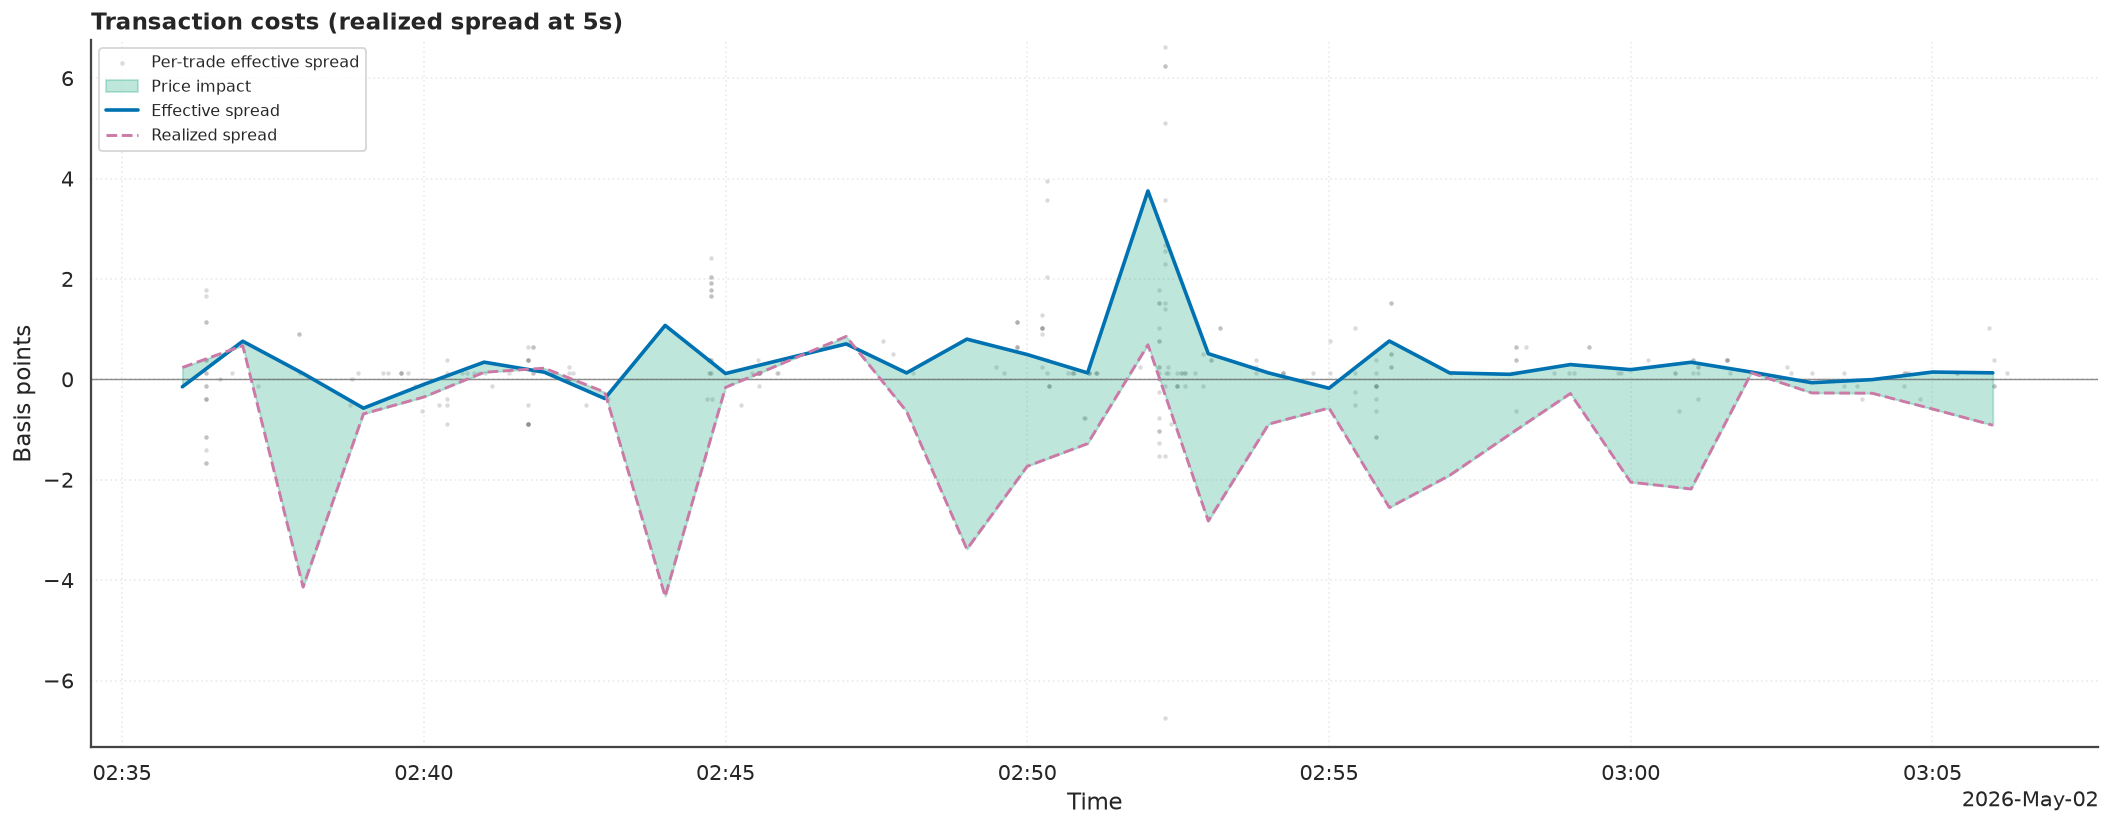
The effective spread split into realized spread and price impact.